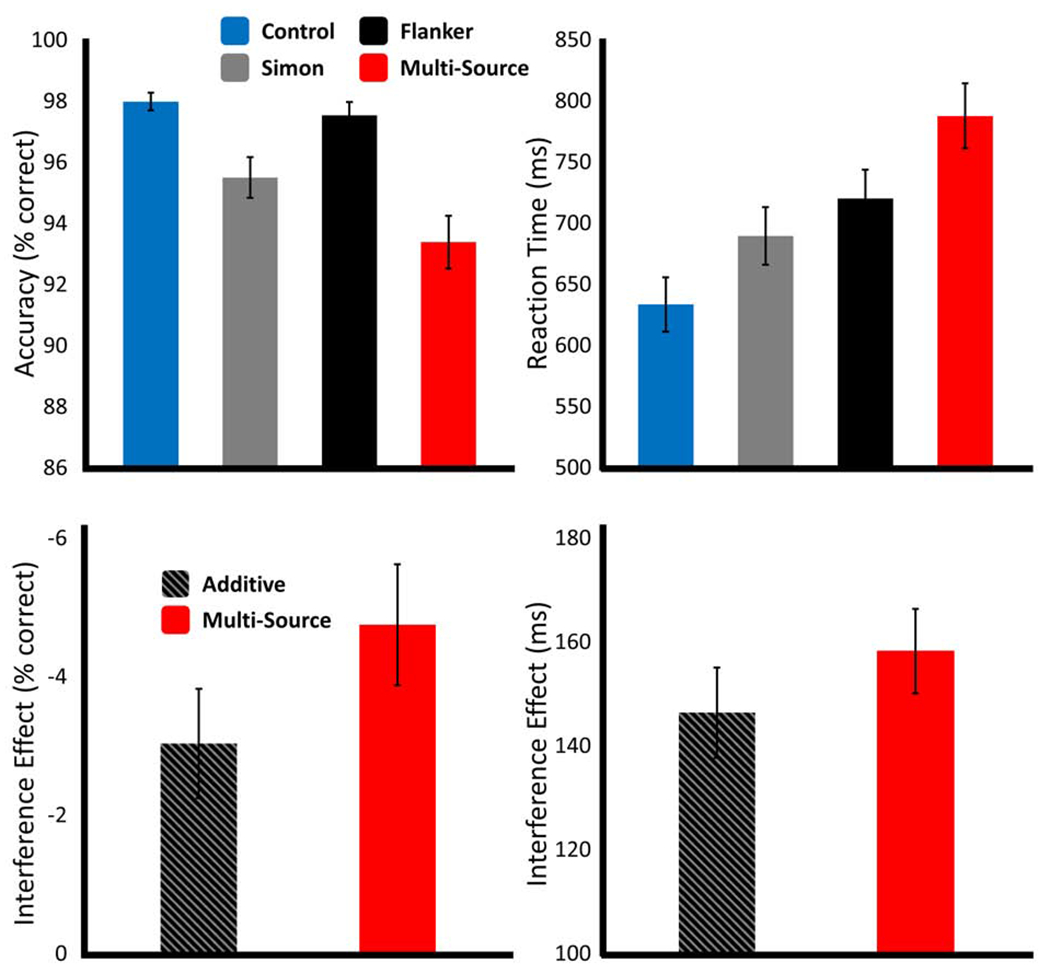
Figure 3. Effects of cognitive interference on behavior.

Results from the behavioral analyses, with data for the main effect of interference condition (top), and for the superadditivity analyses (bottom). Bar graphs represent the mean per condition for accuracy (left; % correct) and reaction time (right; ms), with error bars representing the standard error of the mean (SEM).
