
Fig. 4.
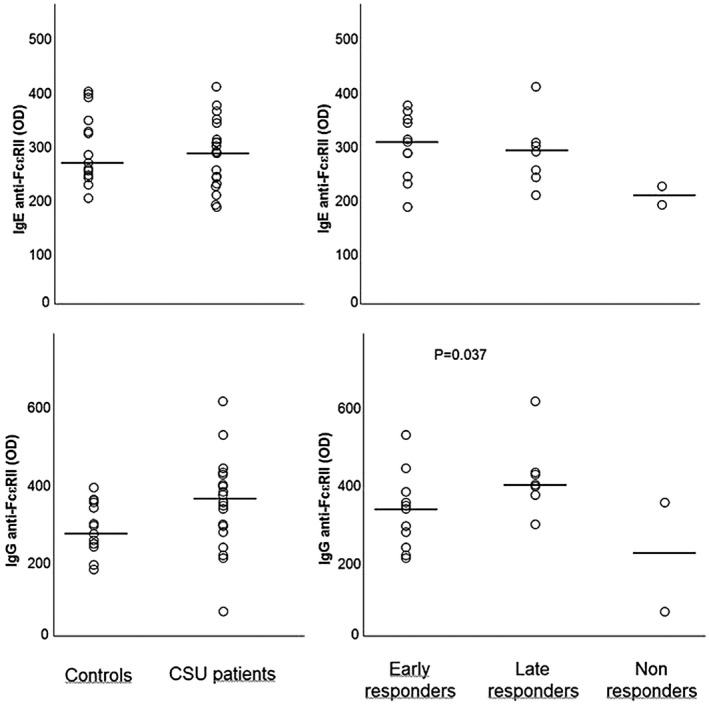
Immunoglobulin (Ig)E and IgG autoimmune response to the low‐affinity IgE receptor (FcεRII) in healthy controls and patient subgroups divided based on clinical response to omalizumab. Horizontal lines represent medians.
Official websites use .gov
A
.gov website belongs to an official
government organization in the United States.
Secure .gov websites use HTTPS
A lock (
) or https:// means you've safely
connected to the .gov website. Share sensitive
information only on official, secure websites.
Immunoglobulin (Ig)E and IgG autoimmune response to the low‐affinity IgE receptor (FcεRII) in healthy controls and patient subgroups divided based on clinical response to omalizumab. Horizontal lines represent medians.