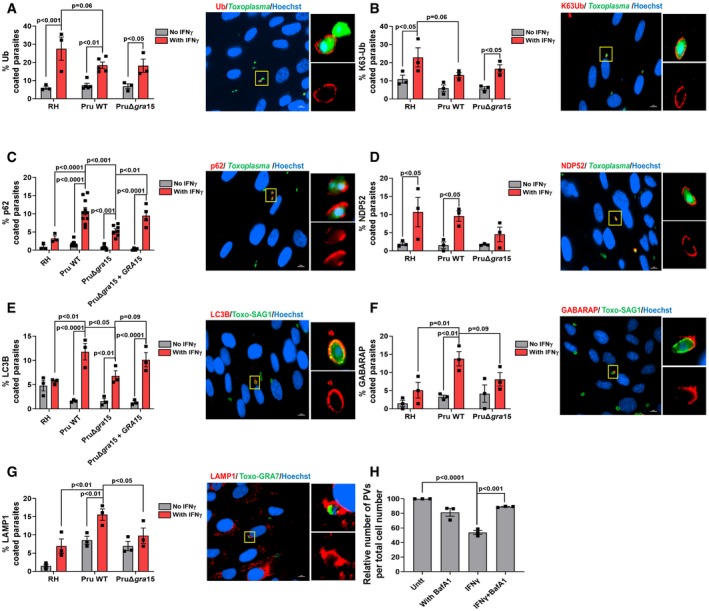
A–GHFFs were stimulated with for 24 h with 10 U/ml IFNγ or left unstimulated and subsequently infected with RH, Pru, or PruΔgra15 parasites for 3 h. The percentage of vacuoles that stained positive for (A) total ubiquitin (n = 3 for RH, n = 5 for Pru, and n = 3 for PruΔgra15), (B) K63‐linked ubiquitin (n = 3 for RH, n = 3 for Pru, and n = 3 for PruΔgra15), (C) p62 (n = 3 for RH, n = 10 for Pru, n = 7 for PruΔgra15, and n = 4 for Pru Δgra15 + GRA15), (D) NDP52 (n = 3 for RH, n = 3 for Pru, and n = 3 for PruΔgra15), (E) LC3B (n = 3 for RH, n = 3 for Pru, n = 3 for PruΔgra15, and n = 3 for Pru Δgra15 + GRA15), (F) GABARAP (n = 3 for RH, n = 3 for Pru, and n = 3 for PruΔgra15), and (G) LAMP1 (n = 3 for RH, n = 3 for Pru, and n = 3 for PruΔgra15) is shown in the left bar diagram. On the right‐hand side, a representative fluorescent image is shown for the Toxoplasma Pru strain, which expresses GFP. DNA was stained with Hoechst 33258. Scale bar is 10 μm. The yellow box inside each representative image is shown as inset pictures with magnification.