-
A
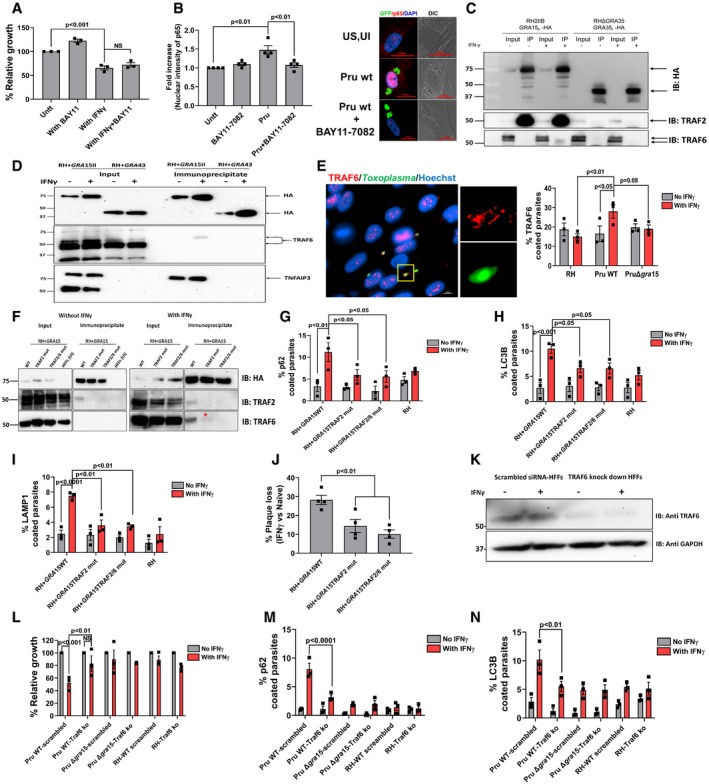
HFFs were stimulated with IFNγ for 24 h (10 U/ml) or left unstimulated. The NF‐κB inhibitor BAY11‐7082 (1 μM) was added 2 h pre‐infection, and HFFs were subsequently infected with Pru parasites. Parasite growth (using luciferase assay) was measured 24 h p.i. Means from unstimulated cells were set at 100%. Experiments were performed three times.
-
B
Nuclear translocation of the NF‐κB p65 subunit was quantified in HFFs or HFFs treated with BAY11‐7082 (1 μM, added 2 h pre‐infection) 24 h p.i. with Pru parasites. Experiments were done four times where each dot represents one experimental mean of at least 15 nuclei. In the right panel, representative images are shown. Parasites were expressing GFP, and nuclei are stained with Hoechst 33258. Scale bar is 20 μm.
-
C
Immunoprecipitation and Western blot were performed in HFFs with and without IFNγ (10 U/ml) using an RH strain expressing type II GRA15‐HA and as a control RH expressing GRA35‐HA. The blots using antibodies against TRAF2 and TRAF6 were made after stripping the first blot. The inputs loaded represent 1% of total lysate prepared for immunoblotting and mass spectrometry (
Table EV1). The antibodies against TRAF2 and TRAF6 were obtained from Santa Cruz Biotechnology (
Appendix Table S2). Full‐length blots for this figure can be observed in the source data for this figure.
-
D
Immunoprecipitation and Western blot were performed in HFFs with and without IFNγ (10 U/ml) using an RH strain expressing type II GRA15‐HA and as a control RH expressing GRA43‐HA. The blots using antibodies against TRAF6 were made after stripping the first blot that is used for HA blotting. The inputs loaded represent 10% of total lysate prepared for immunoblotting. Following TRAF6 blotting, the membrane was stripped and blotted for TNFAIP3. Full‐length blots for this figure can be observed in the source data for this figure.
-
E
Immunofluorescence analysis of TRAF6 recruitment to the PVM of HFFs infected for 3 h with RH, Pru, and PruΔ
gra15 strains. On the right‐hand side, a representative fluorescent image is shown of TRAF6 recruitment to the PVM where
Toxoplasma Pru strain expresses GFP, and DNA was stained with Hoechst 33258. Scale bar is 10 μm.
n = 3 for all the strains. The antibody against TRAF6 was purchased from Abnova (
Appendix Table S2).
-
F
Immunoprecipitation and Western blot were performed in HFFs with and without IFNγ (10 U/ml) using a RH + GRA15WT, RH + GRA15TRAF2mut, or RH + GRA15TRAF2/6mut. For the unstimulated cells, uninfected HFFs were used an additional negative control (left panel). Left panel and right panel were run on a single gel; vertical white lines indicate excision of irrelevant lanes. Full‐length blots are in the source data for this figure. The antibodies used against TRAF2 and TRAF6 were purchased from Cell Signaling Technology and Abnova, respectively. The asterisks (*) in the lower right panel indicates the faint band of TRAF6 in the RH + GRA15TRAF2mut immunoprecipitate.
-
G–I
Immunofluorescence analysis of p62, LC3B, and LAMP1 with and without IFNγ in RH and RH + GRA15WT. All the experiments were done three times with each of the strains.
-
J
Plaque assays were performed with RH + GRA15WT, RH + GRA15TRAF2mut, or RH + GRA15TRAF2/6mut (n = 3).
-
K
Expression of TRAF6 was detected by Western blotting of lysates from scrambled siRNA‐transfected and TRAF6‐specific siRNA‐transfected HFFs with and without IFNγ.
-
L
Relative parasite growth was measured in scrambled siRNA‐transfected HFFs and
TRAF6 knockdown HFFs using luciferase‐based assay with indicated strains with and without IFNγ (
n = 3). The antibody against TRAF6 used here was from Abcam (
Appendix Table S2). Full‐length blots are in source data available online for this figure.
-
M, N
Immunofluorescence analysis of p62 and LC3B was done in scrambled siRNA‐transfected HFFs and TRAF6 knockdown HFFs with and without IFNγ using indicated strains (n = 3).
Data information: Statistical analysis was done by one‐way ANOVA followed with Tukey's multiple comparison test (A, B, and J) and two‐way ANOVA followed with Tukey's multiple comparison test (E, G–I, and L–N). Data are represented as mean ± SEM.

