
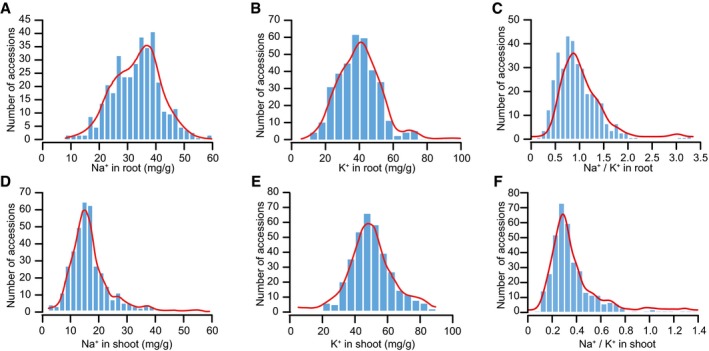
Figure EV1. Frequency distribution of Na+ and K+ contents and Na+/K+ ratio in root and shoot of 369 accessions.
-
A–CFrequency distribution of Na+ (A), K+ (B), and Na+/K+ ratio (C) in roots of the tomato population.
-
D–FFrequency distribution of Na+ (D), K+ (E), and Na+/K+ ratio (F) in shoots of the tomato population.