-
A
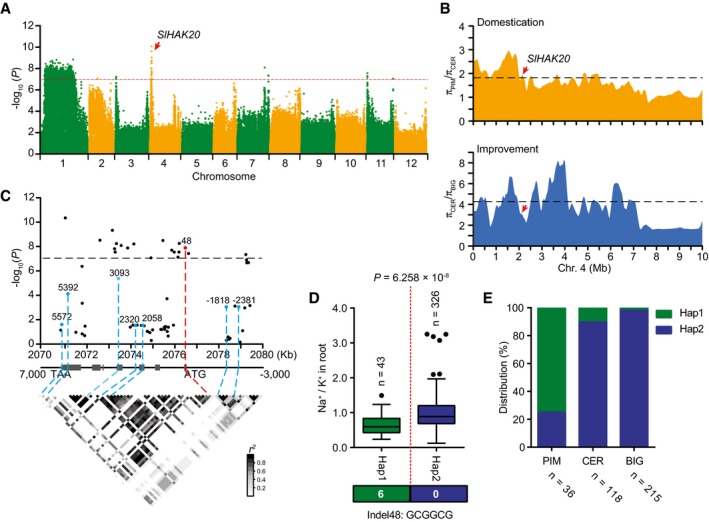
Manhattan plot displaying the GWAS results of Na+/K+ ratio in root. The red dashed line indicates the Bonferroni‐adjusted significance threshold (P = 1.0 × 10⁻⁷). Red arrow indicates the significant SNP signal of Na+/K+ ratio associated with SlHAK20.
-
B
The nucleotide diversity ratios between PIM and CER, and between CER and BIG on chromosome 4. The black dashed horizontal lines indicate top 10% threshold for entire chromosome 4 (1.82 πPIM/πCER for domestication and 4.27 πCER/πBIG for improvement). The red arrows indicate the position of SlHAK20 in the sweeps. π, nucleotide diversity.
-
C
SlHAK20‐based association mapping and pairwise LD analysis. Dots represent SNPs. Indel 48 is highlighted in red. The indel −2,381, indel −1,818 in the promoter region, and five nonsynonymous variants are marked in blue. These eight variants are related to the pairwise LD diagram with dashed lines.
-
D
Haplotypes of SlHAK20 among tomato natural variations. The distribution of Na+/K+ ratio in each haplotype group is exhibited by a box plot. n indicates the number of accessions belonging to each haplotype. In the box plots, the middle line indicates the median, the box indicates the range of the percentiles of the total data using Tukey's method, the whiskers indicate the interquartile range, and the outer dots are outliers. Significant difference was determined by Student's t‐test.
-
E
Allele distribution of the SlHAK20 locus at position in PIM, CER, and BIG groups. n indicates the accession number.

