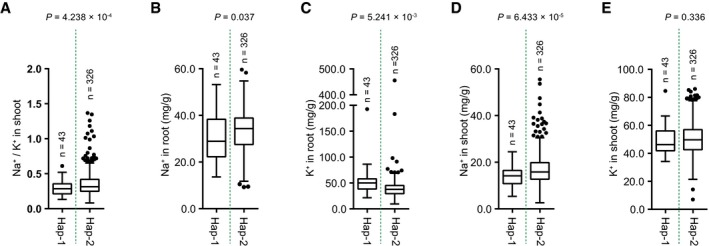
Figure EV3. Analysis of Na+ and K+ contents in two SlHAK20 haplotypes in the population.

-
A–EHaplotype analysis of the SlHAK20 gene based on shoot Na+/K+ ratios (A), root Na+ (B) and K+ (C), and shoot Na+ (D) and K+ (E) contents. Box plots represent the interquartile range using Tukey's method, the line in the middle of each box represents the median, the whiskers represent the interquartile range, and the dots represent outlier points. n indicates the number of accessions belonging to each haplotype. Significant difference was determined by Student's t‐test.
