-
A
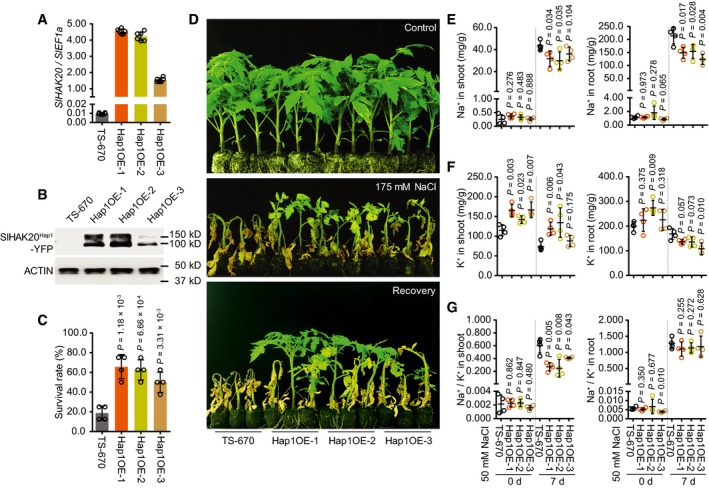
The transcript levels of SlHAK20 in TS‐670 and three independent SlHAK20Hap1‐YFP transgenic lines grown under normal growth conditions.
-
B
The protein levels of SlHAK20Hap1‐YFP in TS‐670 and transgenic plants. Actin was used as loading control.
-
C, D
Phenotypes of transgenic lines in soil under salt stress. The survival rates were obtained from at least eight plants in four repeated experiments (C). 38‐day‐old plants grown in soil as control. 20‐day‐old TS‐670 and Hap1OE‐1 to Hap1OE‐3 were treated with 175 mM NaCl for 3 weeks and recovered for 2 weeks (D).
-
E–G
The Na+ (E) and K+ (F) contents and Na+/K+ ratio (G) in shoots and roots of TS‐670 and three independent SlHAK20
Hap1
‐YFP transgenic lines during salt stress. The 21‐day‐old TS‐670, Hap1OE‐1, Hap1OE‐2, and Hap1OE‐3 plants grown in 0.25× Hoagland, which were then treated with 50 mM NaCl for additional 0 and 7 days.
Data information: In (A), data are shown as means ± SD (
n = 6). In (C) and (E–G), data are shown as means ± SD (
n = 4).
P‐values were determined by Student's
t‐test.

