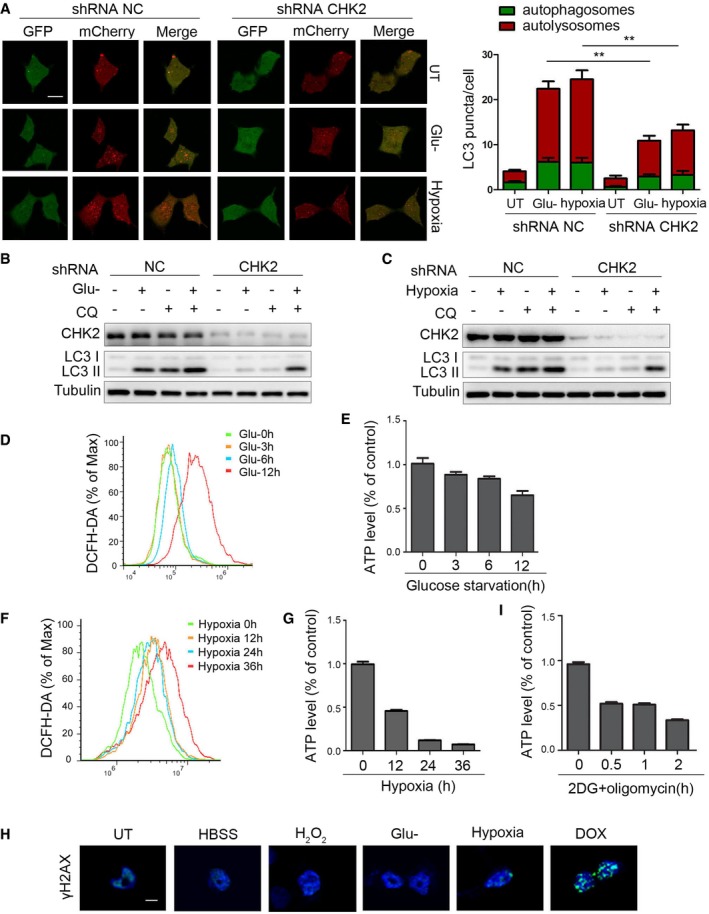
Figure EV4. ROS acts as a signaling molecule to activate the ATM/CHK2/Beclin 1 axis under glucose starvation and hypoxic stress.

-
AAutophagic flux is shown by representative confocal microscopic images for 293 cells stably expressing GFP‐mCherry‐LC3 transfected with the indicated shRNA. Scale bar, 10 μm. Quantitation of autophagosomal (green) and autolysosomal (red) LC3 puncta following 12‐h glucose starvation and 36‐h hypoxia (n = 30). Data are presented as mean ± s.e.m. from three independent experiments; **P < 0.01 (Student's t‐test).
-
BWestern blot detection of LC3 in H1299 cells transfected with the indicated shRNA, pretreated with 30 nM CQ or vehicle (DMSO), and cultured for 12 h in normal or glucose starvation.
-
CWestern blot detection of LC3 in H1299 cells transfected with the indicated shRNA, pretreated with 30 nM CQ or vehicle (DMSO), and cultured for 36 h in normal or hypoxia.
-
D, EIntracellular ROS (D) or ATP (E) levels detected in H1299 cells treated with glucose starvation. Data are presented as mean ± s.e.m. from three independent experiments.
-
F, GIntracellular ROS (F) or ATP (G) levels detected in H1299 cells treated with hypoxia. Data are presented as mean ± s.e.m. from three independent experiments.
-
HH1299 cells detected with γH2AX staining followed by HBSS starvation (1 h), H2O2 treatment (200 μM, 3 h), glucose starvation (10 h), hypoxia (36 h), and DOX (0.5 μM, 3 h). Scale bar, 10 μm.
-
IIntracellular ATP levels detected in H1299 cells treated with 2DG (5 mM) and oligomycin (2.5 μM) treatment. Data are presented as mean ± s.e.m. from three independent experiments.
Source data are available online for this figure.
