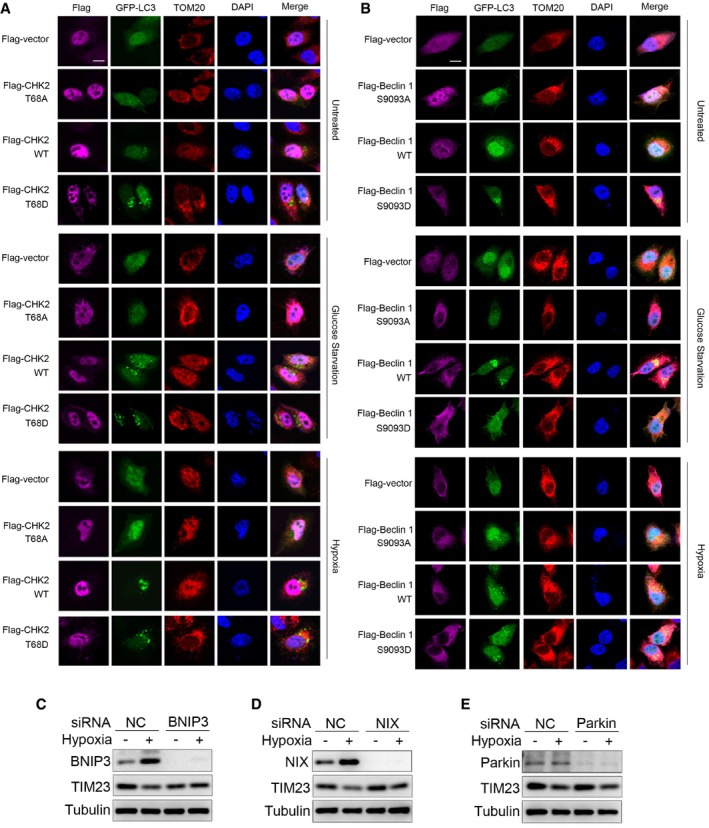
Figure EV5. CHK2‐mediated autophagy limits ROS levels by clearing damaged mitochondria.

-
A, BFluorescence microscopy of the colocalization of GFP‐LC3 with mitochondria (identified with the mitochondrial stain TOM20) in H1299 cells transfected with the indicated plasmid and cultured in untreated (UT), glucose starvation for 12 h, or subjected to hypoxia for 36 h. DAPI, DNA‐binding dye. Scale bar, 10 μm.
-
CWestern blot detection of BNIP3 and TIM23 in H1299 cells transfected with the indicated siRNA and untreated or subjected to hypoxia for 36 h.
-
DWestern blot detection of NIX and TIM23 in H1299 cells transfected with the indicated siRNA and untreated or subjected to hypoxia for 36 h.
-
EWestern blot detection of parkin and TIM23 in H1299 cells transfected with the indicated siRNA and untreated or subjected to hypoxia for 36 h.
Source data are available online for this figure.
