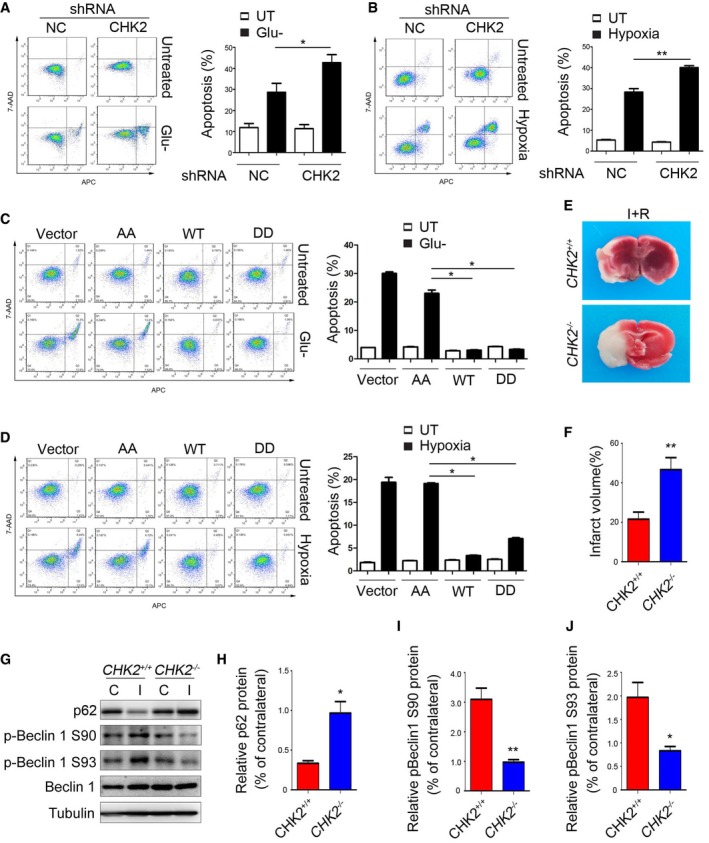
Figure 7. CHK2‐mediated autophagy protects against cell death and tissue damage following cerebral ischemia.

-
A, BH1299 cells transfected with the indicated shRNA in normal medium or after 12‐h glucose starvation (A) or 48‐h hypoxia stimulation (B). Representative FACS analysis of apoptosis. Data are presented as mean ± s.e.m. from three independent experiments; *P < 0.05 compared to NC glucose starvation (A); **P < 0.01 compared to NC hypoxia (B) (Student's t‐test).
-
C, DH1299 cells transfected with the indicated plasmids in normal medium or after 12‐h glucose starvation (C) or 48‐h hypoxia stimulation (D). Representative FACS analysis of apoptosis. Results from three independent experiments are presented as a histogram. Data are presented as mean ± s.e.m. from three independent experiments; *P < 0.05 compared to Beclin 1 S9093A (AA) treated with H2O2 or hypoxia (Mann–Whitney test).
-
ECHK2 +/+ and CHK2 −/− mice were subjected to MCAO for 1 h and reperfusion for 12 h. Contralateral (C) and ipsilateral (I) tissues of the mouse brain were coronally sectioned and stained with 2% TTC.
-
FThe infarct volume was determined by measuring infarct size relative to normal in the slice. (n = 5 mice). Data are presented as mean ± s.e.m.; **P < 0.01 (Student's t‐test).
-
G–JImmunoblots for p62, p‐Beclin 1 Ser90, p‐Beclin 1 Ser93, and Beclin 1 in the cortical extracts from ischemia‐ and reperfusion‐treated CHK2 +/+ and CHK2 −/− mice. Quantification of p62, p‐Beclin 1 Ser90, and p‐Beclin 1 Ser93 protein levels (n = 3 mice). Data are presented as mean ± s.e.m.; *P < 0.05, **P < 0.01 (Student's t‐test).
Source data are available online for this figure.
