
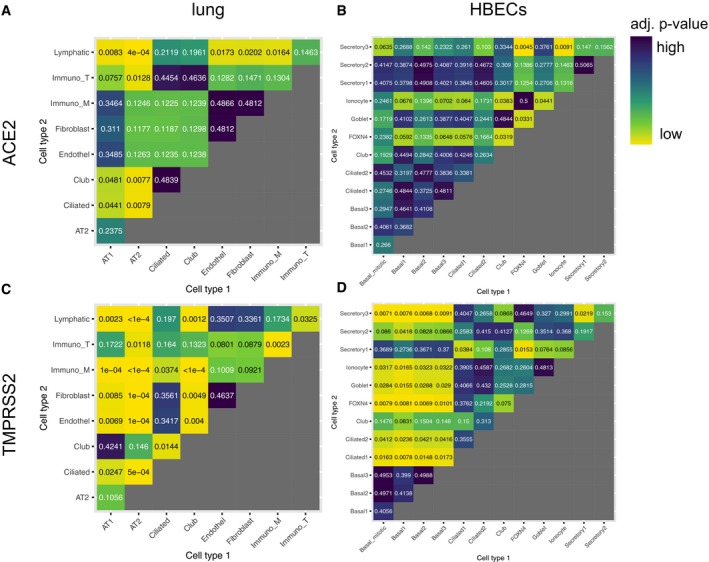
Figure EV1. Statistical analysis of ACE2 and TMPRSS2 expression differences.
-
A–DHeatmaps indicating the P‐values of comparisons of expression levels between different cell types in the lung (A, C) and HBECs (B, D).
Official websites use .gov
A
.gov website belongs to an official
government organization in the United States.
Secure .gov websites use HTTPS
A lock (
) or https:// means you've safely
connected to the .gov website. Share sensitive
information only on official, secure websites.