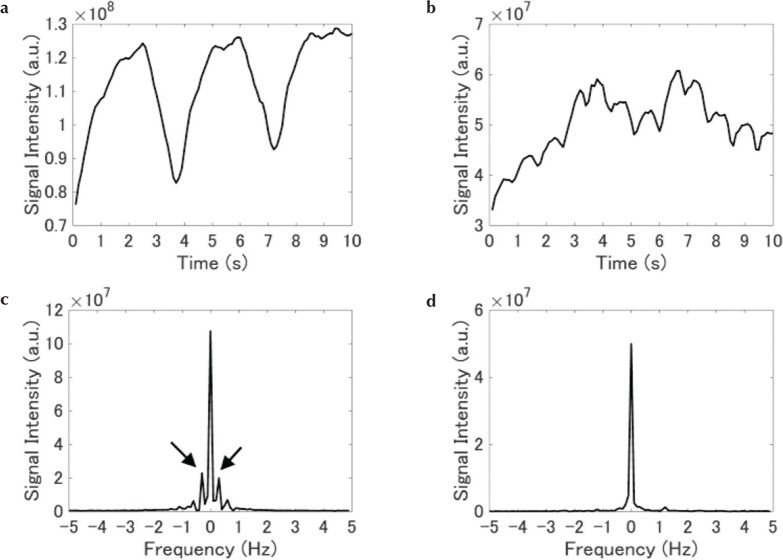
Fig. 2.
Example of different coil sensitivities to respiratory motion. (a and b) Raw navigator signals from different two coil elements. (c and d) Fourier transformed data in the time domain. Spectra in (c) and (d) are generated from (a) and (b), respectively. The waveform in (a) reflects respiratory motion well, and resultant spectrum in (c) has obvious peaks from 0.1 to 0.5 Hz in absolute value (arrows).

