Figure 1.

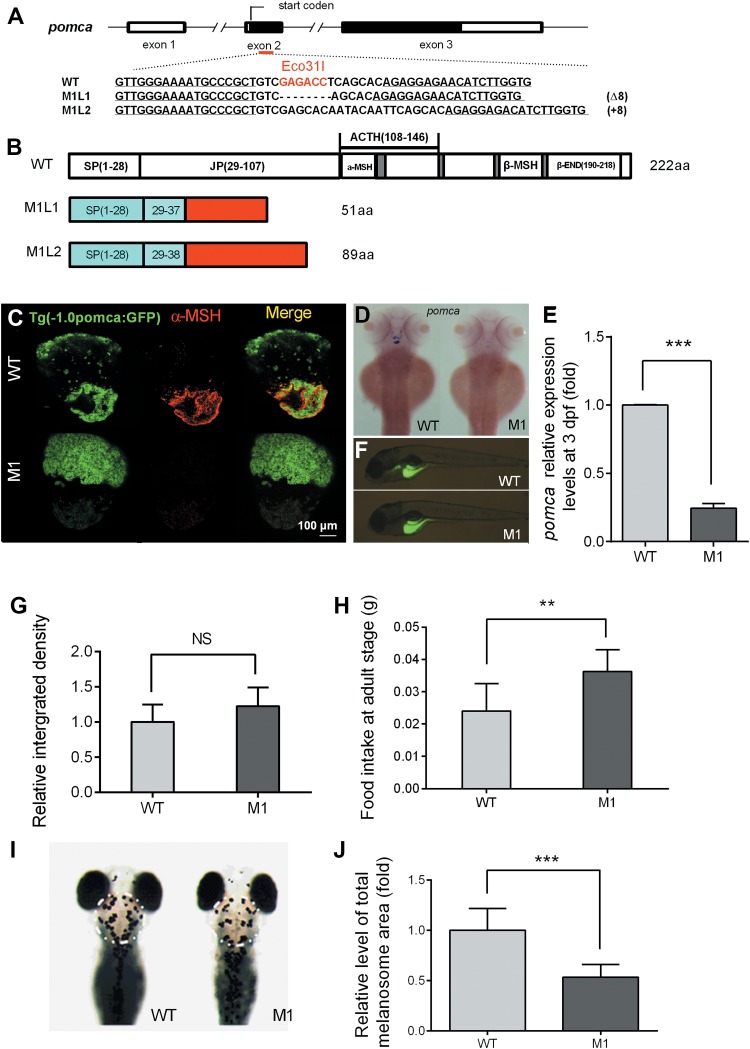
Disruption of pomca caused impaired dark-induced melanosome dispersal in larval zebrafish. (A) The schematic represents engineered TALENs on pomca, exon 2. The underlined fonts indicate the sequences of the two targeting arms of TALENs, and the red fonts show the cutting site of restriction enzyme Eco31I. (B) The diagram shows the predicated POMCa protein from WT, M1L1, and M1L2 zebrafish. The mutant lines with putative peptides identical to those of WT fish are shown as blue areas, and the red areas indicate miscoded amino acids. (C) GFP (pomca: GFP) expression pattern and α-MSH immunofluorescence of the pituitary gland in pomca M1 fish and WT control siblings at 150 dpf. (D) Dorsal view of endogenous pomca mRNA expression patterns in the pituitary gland and hypothalamic of WT (n = 12) and pomca M1 fish (n = 10) at 3 dpf. (E) Relative expression levels of pomca mRNA in pomca M1 fish and WT zebrafish at 3 dpf (n = 3/group). (F) Feeding assay of WT and pomca M1 zebrafish using 4-Di-10-ASP-labeled paramecia at 6 dpf. (G) Relative levels of ingested paramecia shown as fluorescence intensities (n = 7/group). (H) Total food intake in 2 h by WT and pomca M1 adult fish after 5 days of starvation (n = 8–10/group). (I) Image of 4 dpf WT and pomca M1 fish exposed to darkness for 30 min. The area of melanosome measurement is shown by the white circle. (J) The diagram shows the relative values of total melanosome area of the indicated regions (n = 10/group). `NS’ indicates that there were no significant differences between two groups.
