
Figure 2.
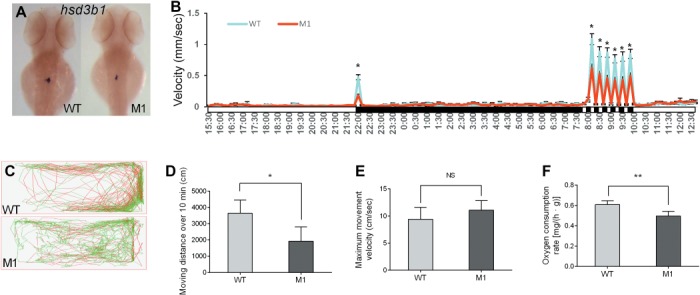
POMCa deficiency reduced anxiety-like behaviors and basal metabolism in zebrafish. (A) Whole-mount in situ hybridization (WISH) assay of hsd3b1 expression in interrenal glands of WT (n = 10) and pomca M1 fish (n = 10) at 3 dpf. (B) The dark–light emergence test was applied to larval zebrafish at 4 dpf. The white boxes below the horizontal line indicate periods of light, and the black boxes represent periods of darkness (n = 48/group). (C) The locomotor trajectory of WT and pomca M1 adult fish within 10 min. The movement velocity >8 cm/sec and <1 cm/sec are represented by red and gray locomotor trajectories, respectively. The movement velocity between 1 and 8 cm/sec is represented by a green locomotor trajectory. (D) Total distance moved over 10 min by WT and pomca M1 fish (n = 6/group). (E) The maximum movement velocity within 10 min (n = 6/group). (F) The oxygen consumption rates of WT and pomca M1 fish were measured at 150 dpf after 5 days of starvation (n = 4/group). `NS’ indicates that there were no significant differences between two groups.