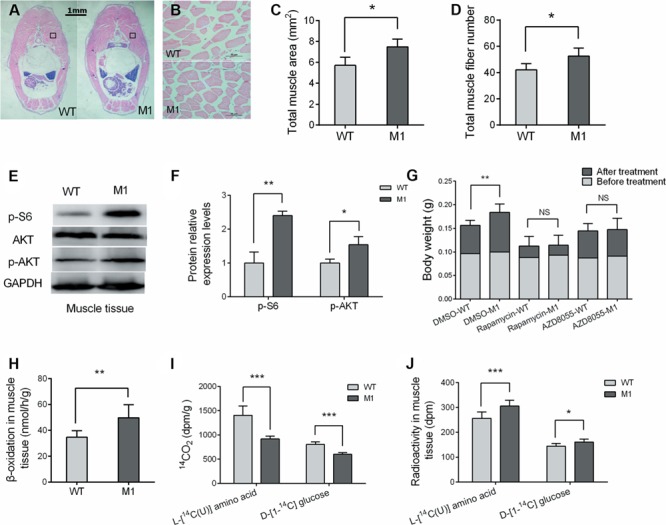
Figure 4.

POMCa deficiency increased protein synthesis and fatty acid β-oxidation in muscle tissue. (A and B) H&E staining of the muscle tissue (A) and higher magnification of the indicated regions (B). (C) The diagram shows the total area of muscle tissue in the body cross-section (n = 5/group). (D) The total fiber numbers of the indicated regions of WT and pomca M1 fish (n = 5–6/group). (E) Western blot analysis of p-s6 and p-AKT proteins from muscle tissue of pomca M1 fish and WT fish. GAPDH protein was used as an internal control. (F) Western blots were quantified by gray value analysis using ImageJ software (n = 3/group). (G) The body weight before and after treatment with two independent mTORC1 inhibitors, rapamycin, and AZD8055 (n = 7–10/group). (H) Muscle tissue capacity of mutants and their control siblings to oxidize [1-14C] palmitic acid (n = 6/group). (I) The conversion of the intraperitoneally injected L-[14C(U)] amino acid mixture and D-[1-14C] glucose into carbon dioxide in 2 h (n = 6/group). (J) Retained radioactivity in muscle after the intraperitoneally injected L-[14C(U)] amino acid mixture and D-[1-14C] glucose (n = 5–6/group). `NS’ indicates that there were no significant differences between two groups.
