Figure 5.

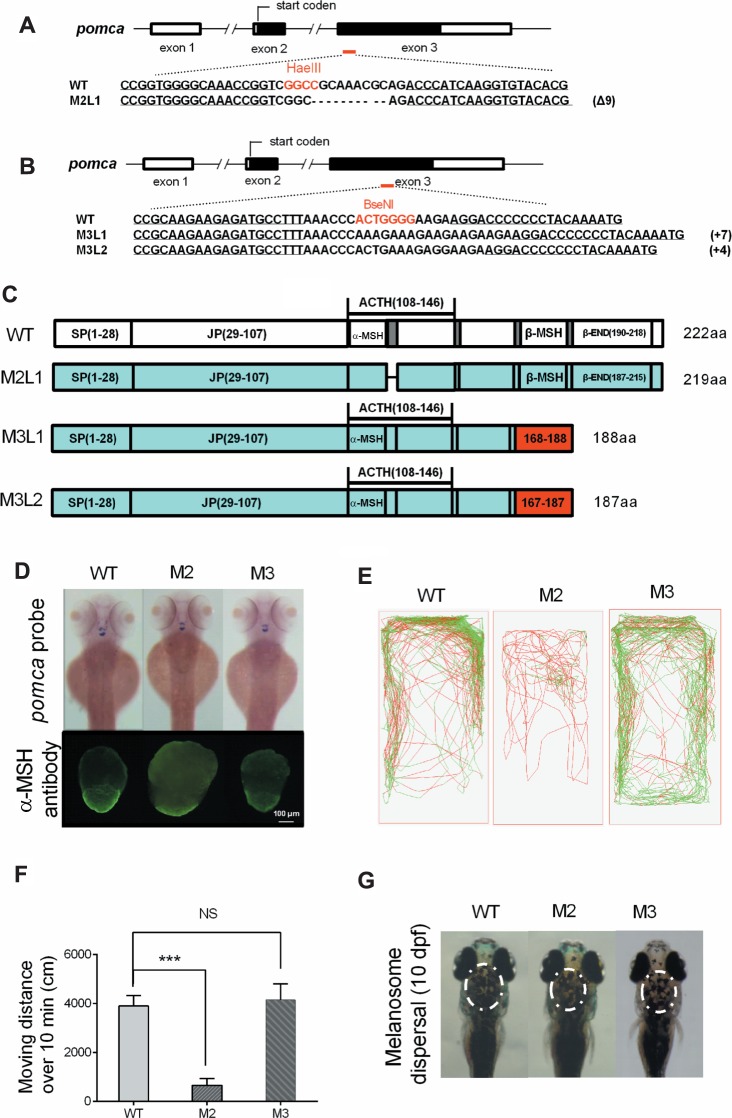
Generation of POMCa truncated mutations in zebrafish via TALENs. (A) The schematic represents engineered TALENs in pomca. The restriction enzyme HaeIII was used to identify the genotypes. The underlined fonts indicate the sequences of the two targeting arms of TALENs. (B) The schematic represents engineered TALENs in pomca. Two independent types of pomca mutant 3, M3L1 and M3L2, were generated with insertions of 7 bp and 4 bp, respectively. (C) The diagrams show the predicated POMCa protein of pomca M2 and M3 fish compared with the WT POMCa protein. (D) The upper figure shows the dorsal view of endogenous pomca mRNA expression in the pituitary gland and hypothalamic of WT (n = 15), pomca M2 (n = 13), and M3 fish (n = 12) at 3 dpf. The bottom figure represents α-MSH immunofluorescence of the pituitary gland in pomca M2 and M3 fish at 150 dpf. (E) The locomotor trajectory of pomca M2 and M3 adult fish (bottom) within 10 min. (F) Total distance moved of WT, pomca M2 and M3 fish over 10 min (n = 10/group). (G) The melanosome was imaged at 10 dpf following treatment with 30 min darkness. `NS’ indicates that there were no significant differences between two groups.
