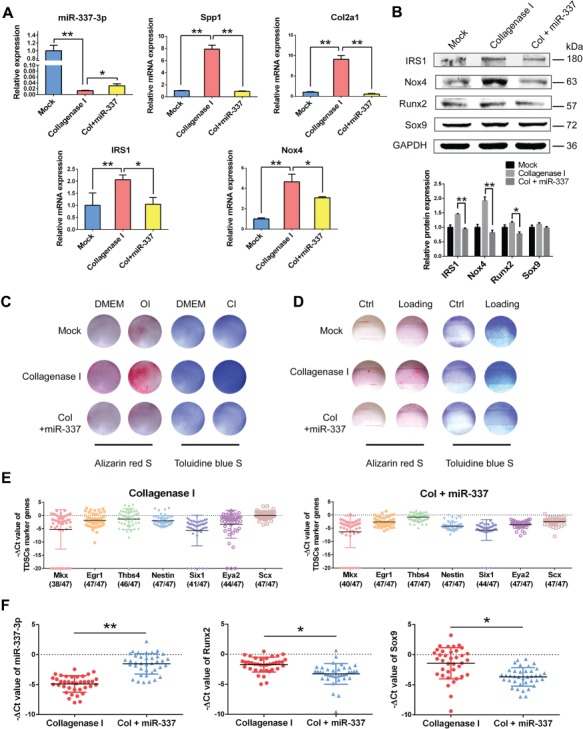
Figure 6.

rTDSCs from rat tendinopathy group and miR-337-3p curing group present different chondro-osteogenic differentiation ability. (A) Real-time PCR analysis of miR-337-3p and indicated genes of rTDSCs derived from each group. (B) Western blot analysis of miR-337-3p target genes and chondro-osteogenic genes in rTDSCs derived from each group. The densitometric analysis of each protein expression was normalized to GAPDH. Three independent experiments were analyzed for the bar graph below. (C) Alizarin red staining (left) and Toluidine blue staining (right) of rTDSCs derived from each group cultured in regular medium (DMEM), osteogenic-induced medium (OI), or chondrogenic-induced medium (CI) for 10 days. (D) Alizarin red staining (left) and Toluidine blue staining (right) of rTDSCs derived from each group with or without mechanical loading (10%, 8 h/day) for 10 days. (E and F) Single-cell PCR analysis of flow sorted rTDSCs (CD90+, CD45−) freshly derived from collagenase I-treated group and miR-337 overexpressing lentivirus group. (E) The expression of TDSC marker genes Mkx, Egr1, Thbs4, Nestin, Six1, Eya2, and Scx was normalized to Gapdh. (F) The expression of miR-337-3p, Runx2, and Sox9 in single cells with positive TDSC markers in either collagenase I-treated group or miR-337 overexpressing group. Numbers in parenthesis indicate cells positive for TDSC markers. Error bars, SEM (n = 3). *P < 0.05; **P < 0.01.
