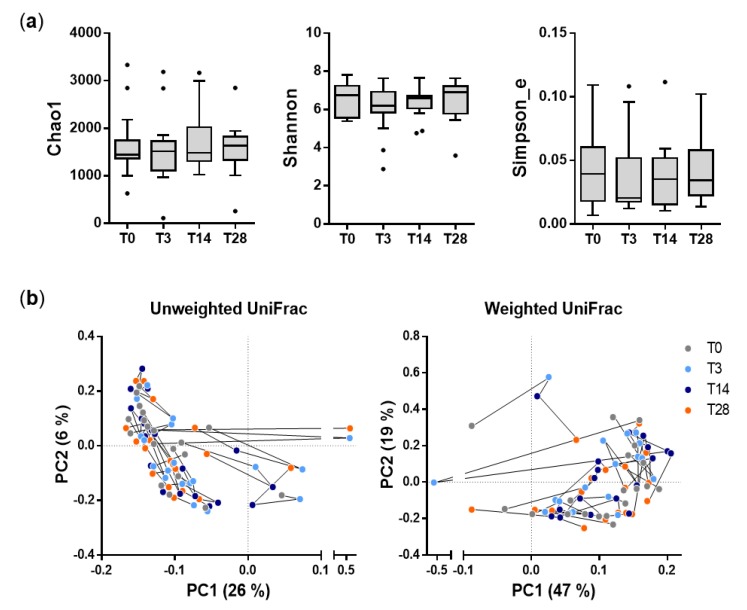
Figure 2.
Diversity analysis of fecal bacterial communities during the probiotic intervention trial. (a) α-diversity analysis; the panel shows three indexes that differently describe the richness and evenness of bacterial communities in fecal samples. (b) β-diversity analysis based on principal coordinate analysis of unweighted (left) and weighted (right) UniFrac distances. Each point in the graph represents a different fecal sample. Colors indicate the different phases of the study, according to the legend on the right. Black lines connect samples from the same subject. The percentages indicate the proportions of variance explained by the first and second ordination axes.

