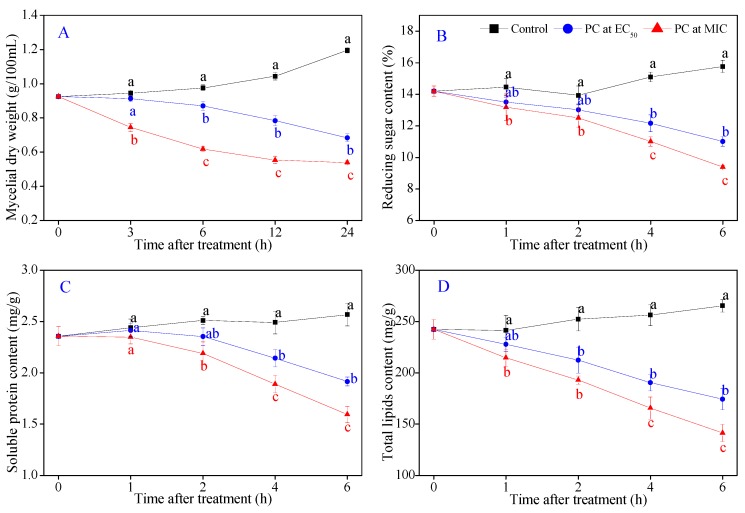
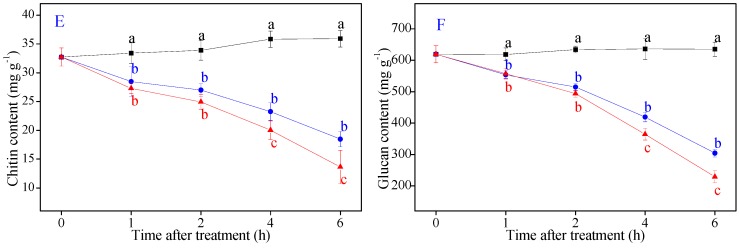
Figure 6.
Effects of P7G on mycelial dry weight (A), reducing sugar content (B), soluble protein content (C), total lipid content (D), chitin content (E) and glucan content (F) of P. italicum in PDB. Each value is the mean of three replicates (n = 3), and the vertical bar indicates the standard error (S.E.). The values with different lowercase letters within the same time point indicate a significant difference between the control and the P7G-treated mycelia, according to Duncan’s test at p < 0.05.


