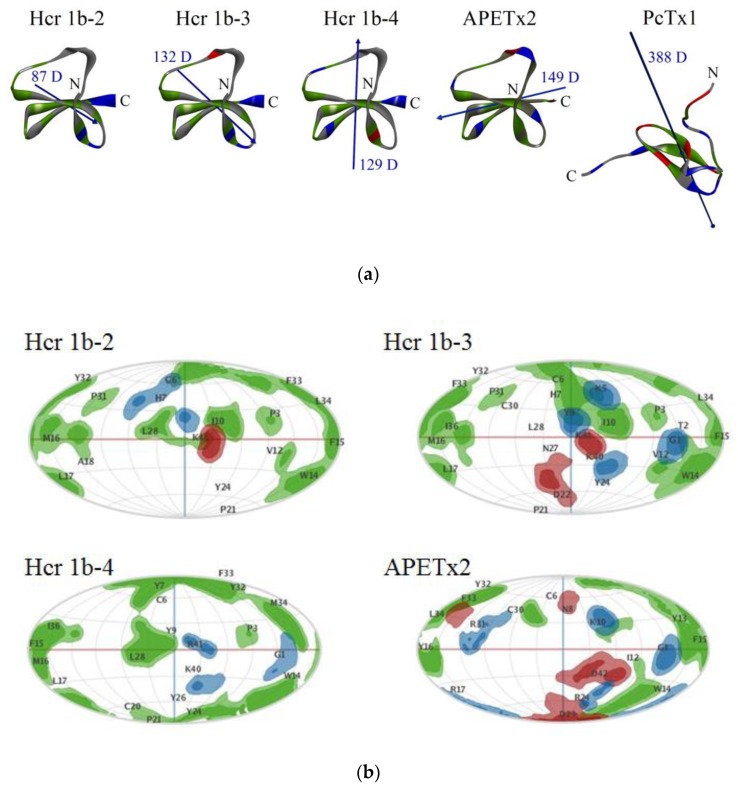
Figure 3.
Homology models of Hcr 1b-2, -3, -4 and spatial structures of APETx2 and PcTx1. (a) Ribbon representation of peptide molecules and hydrophobic, basic, and acidic residues are colored green, blue, and red, respectively. Dipole moments are shown as blue arrows; magnitude of dipole moments is indicated as Debye. Visualization is performed with Discovery studio 4.0 Visualizer software [41]. (b) The spherical projection maps of surface electrostatic and hydrophobic properties for Hcr 1b-2, -3, -4, and APETx2 peptides performed with Patch analysis suite in MOE 2019.0102 CCG® software [42]; the molecules on panel (b) are presented in one orientation which shows the functionally important residues of APETx2. The residue projections are labeled in a one letter code. The hydrophobic, basic, and acidic areas are presented as green, blue, and red, respectively.

