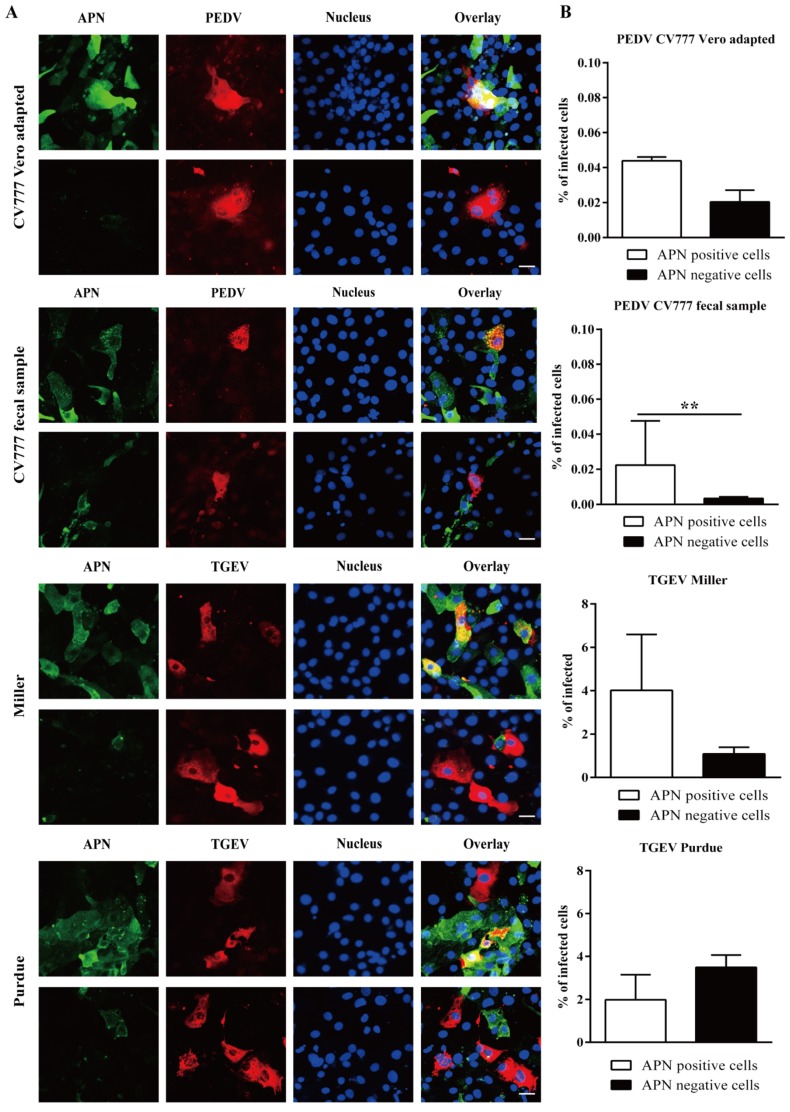
Figure 4.
Infection of APN positive/negative enterocytes with PEDV and TGEV. (A) Double immunofluorescence staining of APN (green) and PEDV/TGEV (red) in primary enterocytes. Scale bar: 25 µm. (B) Percentage of infected cells within the population of APN positive and negative cells. Data are expressed as the mean ± SD of the results of three separate experiments. Statistically significant differences between APN positive and APN negative cells are presented as **p < 0.01.

