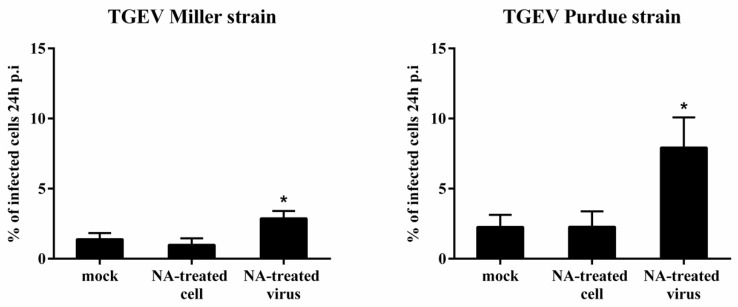
Figure 5.
Effect of neuraminidase N (NA) treatment of enterocytes or virus on the infection of TGEV Miller and Purdue in enterocytes. The percentage of infection was evaluated 24 h post inoculation. Data are expressed as mean ± SD of the results of three separate experiments. Statistically significant differences in comparison with data from mock treatment are presented as *p < 0.05.

