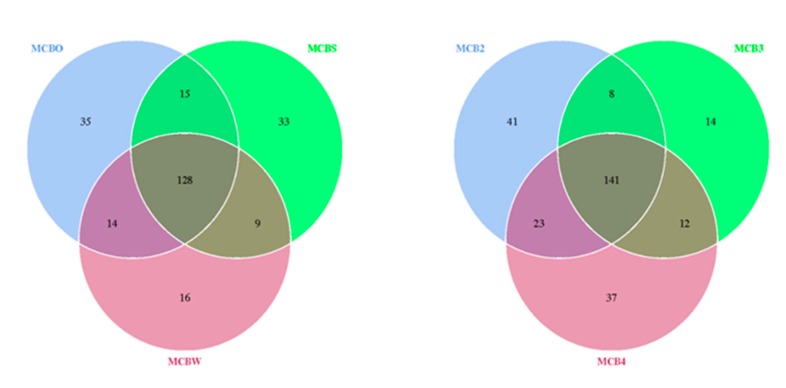
Figure 5.
Venn diagram showing the degree of overlap of bacterial operational taxonomic units (OTUs) between the swab samples obtained from the purchased cutting board (MCBO), the scraped cutting board (MCBS) and the rinsed cutting board (MCBW). MCB2, MCB3 and MCB4 represent sampling after the second, third and fourth experimental repetitions, respectively. The numbers of shared and unique OTUs between bacterial species are shown.

