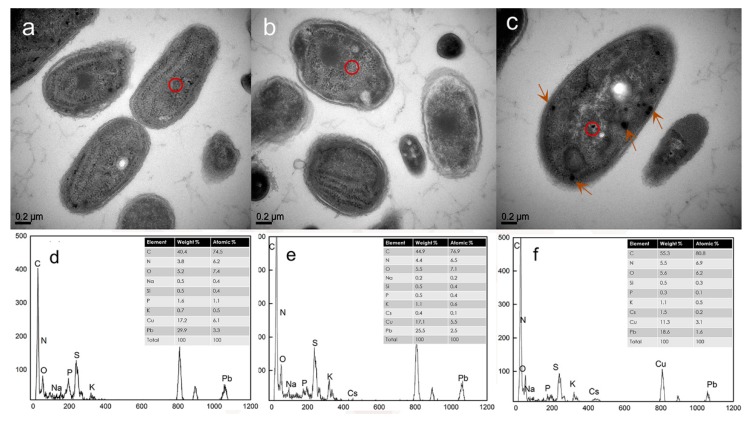
Figure 9.
TEM images and corresponding EDX spectra of Synechococcus PCC7002 before and after the adsorption of Cs at different concentrations: (a,d) 0 g/L (untreated biomass), (b,e) 0.5 g/L, and (c,f) 5 g/L of Cs ions. The red circles in the TEM images indicate the locations of EDX analysis. The arrows in Figure 9c indicate the precipitates in the cytoplasm, which demonstrate the intracellular uptake of Cs ions.

