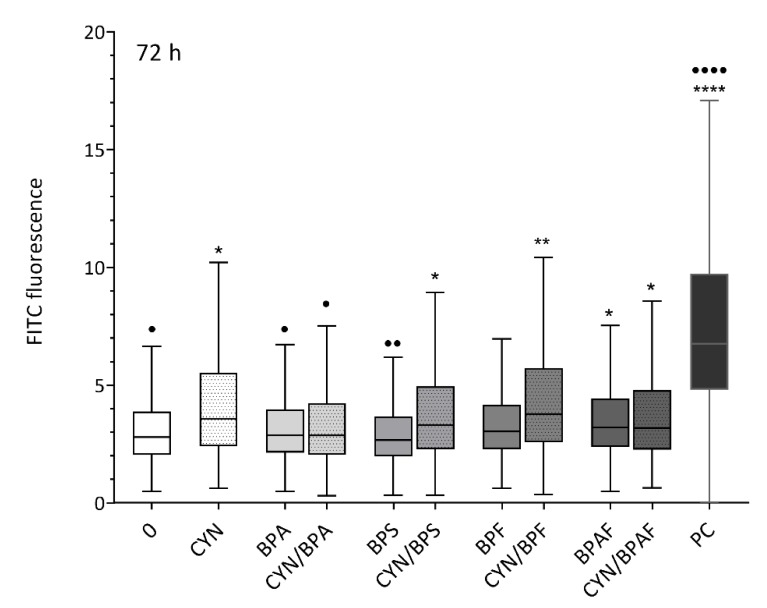
Figure 2.
The effect of single compounds and binary mixtures of CYN (0.5 µg/mL) and BPs (BPA, BPS, BPF, BPAF; 10 µg/mL) on the induction of γ-H2AX formation (a sensitive marker for DNA double-strand breaks (DSBs)) in HepG2 cells after 72 h of exposure, using flow cytometry. The data are presented as quantile box plots. The edges represent the 25th and 75th percentiles, the solid line through the box is the median, and the error bars represent 95% confidence intervals. The solvent control (0 = 0.05% methanol and 0.04% DMSO) and a positive control (Etoposide ET, 1 μg/mL) were included in the experiment. The asterisks (*) denote statistically significant difference between solvent control and treated cells (* p ≤ 0.05; ** p ≤ 0.01; **** p ≤ 0.0001). The dots (•) denote a statistically significant difference between CYN alone and CYN/BPs treated cells (• p ≤ 0.05; •• p ≤ 0.01; •••• p ≤ 0.0001).

