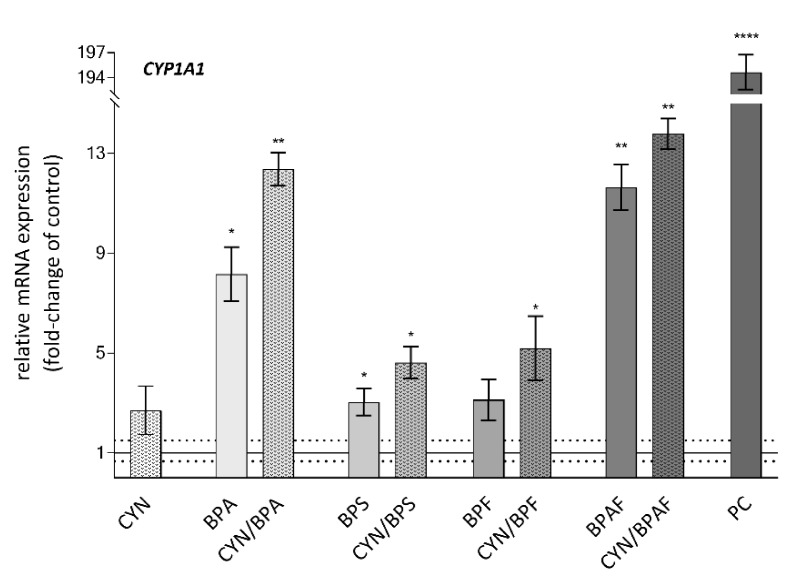
Figure 3.
The effect of CYN (0.5 µg/mL), BPs (BPA, BPS, BPF, BPAF; 10 µg/mL) and their binary mixtures on the expression of the CYP1A1 gene, involved in xenobiotic metabolism, in HepG2 cells after 24 h of exposure. The deregulations are expressed in the fold-change of expression of the gene in the solvent control group (0.05% methanol and 0.04% DMSO = solid line at value 1.0). PC is the positive control—Benzo[a]pyrene BaP (30 μM). The dotted line denotes biologically significant differences in gene expression (1.5-fold change). The asterisks (*) denote a statistically significant difference between solvent control and treated cells (* p ≤ 0.05; ** p = 0.01; **** p = 0.0001).

