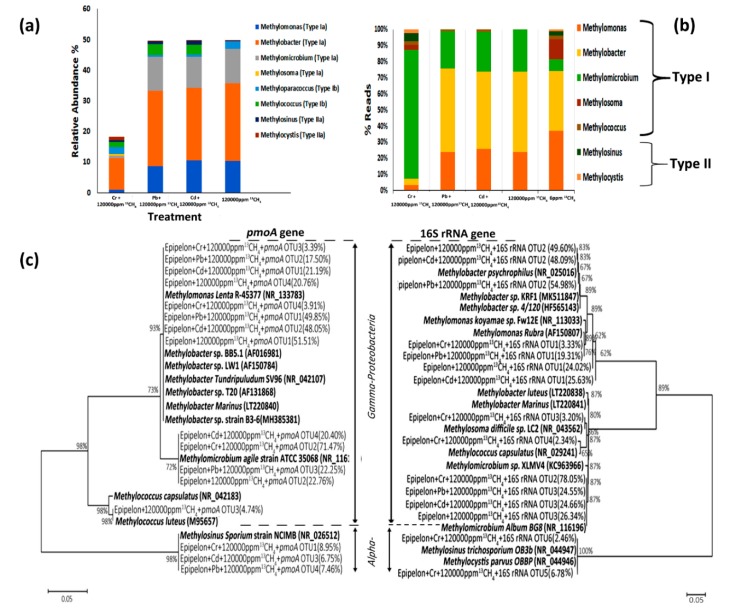
Figure 6.
Methanotrophic community compositions of 13C-labeled MOB based on phylogenetic tree analysis of 16S rRNA and pmoA genes. (a) Percentage of type Ia, Ib, II and IIa methanotrophs were computed from the 13C-labeled genes. (b) Percentages of type I and II MOB were determined from16S rRNA high throughput sequencing of the 13C-labeled genes (c) Neighbor-joining phylogenetic tree depicts the phylogenetic relationship of dominant OTU sequences with the known MOB sequences from GenBank. The percentages illustrate the relative sequence abundance of each OTU to the total MOB-affiliated 16S rRNA or pmoA genes. Bootstrap values higher than 60% are pointed at the branch nodes.

