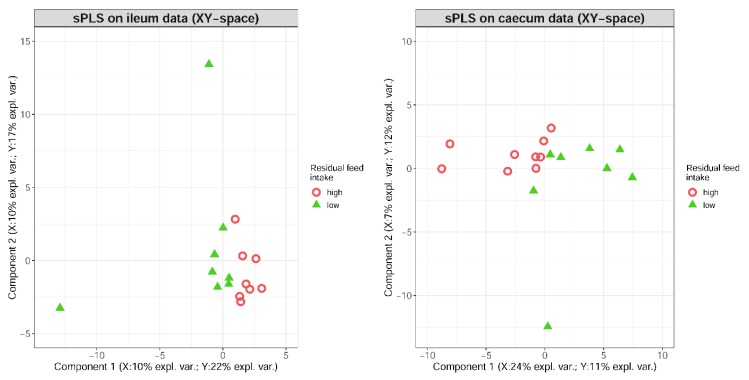
Figure 2.
Differentiation of high (red circles) and low (green triangles) residual feed intake samples in ileum (left panel) and caecum tissues (right panel) using sparse partial least squares (sPLS). The bioinformatics approach considers the selection of 100 genes (dataset X) and 10 microbes (dataset Y) per component.

