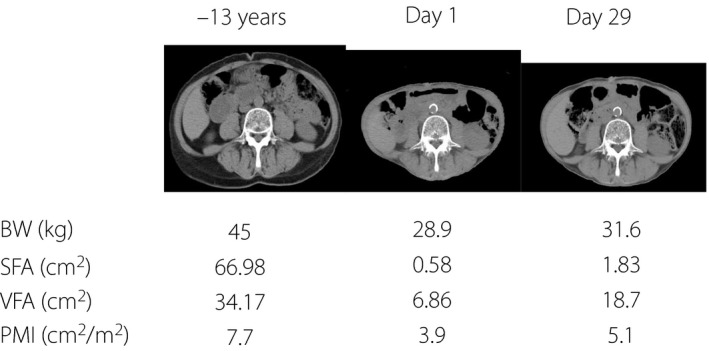
Figure 2.

Changes of bodyweight (BW), visceral fat area (VFA), subcutaneous fat area (SFA) and psoas muscle mass index (PMI). Comparison of computer tomography at L3 vertebrae. Changes of BW, VFA, SFA and PMI at –13 years on day 1 and on day 29 are shown. PMI is calculated as the bilateral psoas muscle area at the L3 vertebrae on computed tomography (cm2) / height2 (m2).
