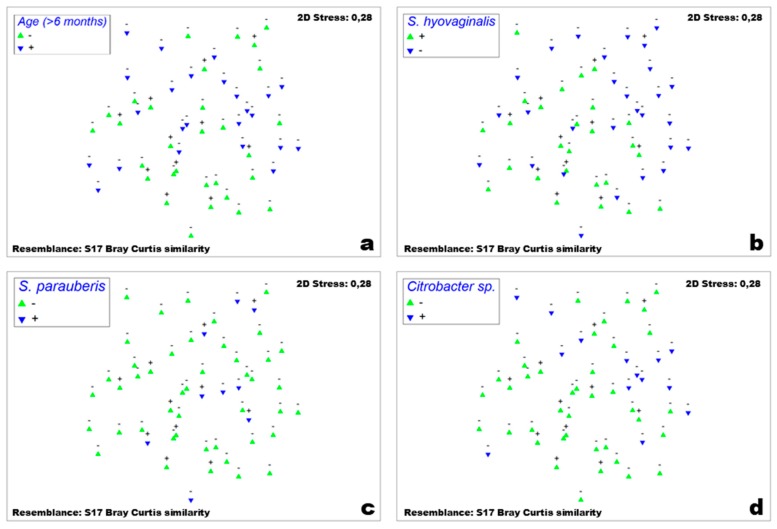
Figure 7.
Non-metric multidimensional scaling plot of all samples. MRSA-positive samples are marked with “+”, MRSA-negative samples are marked with “−” above the symbols. (a) Green triangles represent samples of pigs that were six months of age or younger, blue inverted triangles represent samples of pigs that were older than six months on sampling date. (b) Green triangles represent samples of pigs that were positive for S. hyovaginalis colonization, blue inverted triangles represent samples of pigs that were negative for S. hyovaginalis colonization on sampling date. (c) Green triangles represent samples of pigs that were negative for S. parauberis colonization, blue inverted triangles represent samples of pigs that were positive for S. parauberis colonization on sampling date. (d) Green triangles represent samples of pigs that were positive for Citrobacter sp. colonization, blue inverted triangles represent samples of pigs that were negative for Citrobacter sp. colonization on sampling date.

