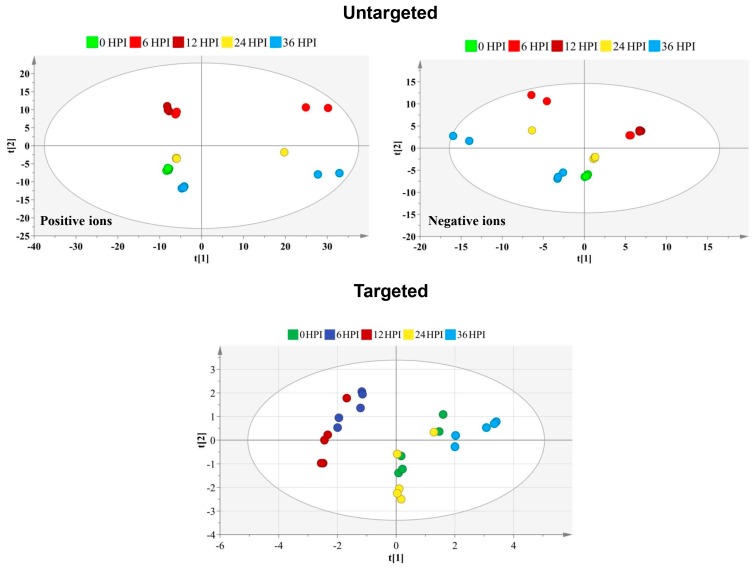
Figure 2.
Score plot generated from the PCA-X model of untargeted and targeted metabolites. For the untargeted approach, the principal components analysis (PCA) score plot is presented separately for the positive and negative ion mode. The t [1] and t [2] values of each data point are the average scores of all samples in the principal components 1 and 2 of the model, respectively. Below is displayed the PCA score plot based on the 59 targeted metabolites identified at different time points after CrPV infection in S2 cells. Samples of different time points are shown in different colors that reveal satisfactory separation among particular samples. Incomplete separation is observed between 6 HPI and 12 HPI time points and between 0 HPI and 24 HPI samples.

