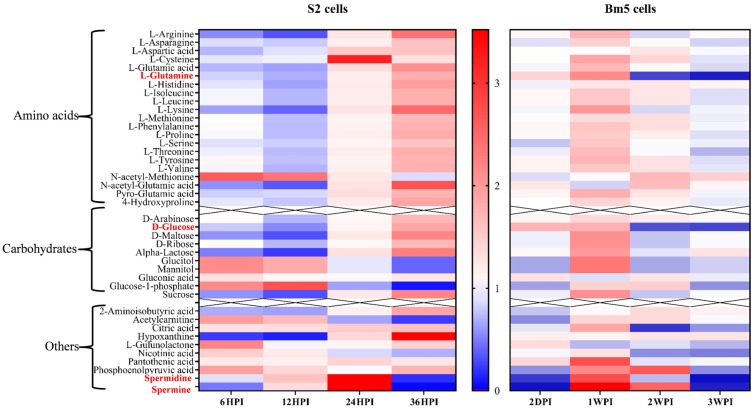
Figure 8.
Comparison of relative abundances of metabolites after infection of S2 and Bm5 cells with CrPV. Intensities reflect relative decrease (in blue) or increase (in red) of the metabolite with respect to uninfected cells (average of N = 5). The different pattern of amino acids and carbohydrates in S2 cells (down-up) and Bm5 cells (up-down) is clearly apparent. Red colored are glutamine and glucose that show a characteristic increase at the end of infection with the S2 cells, while there was an opposite effect with a clear unique decline in Bm5 cells. Spermine and spermidine that show a dynamic pattern in both types of infections are also indicated.

