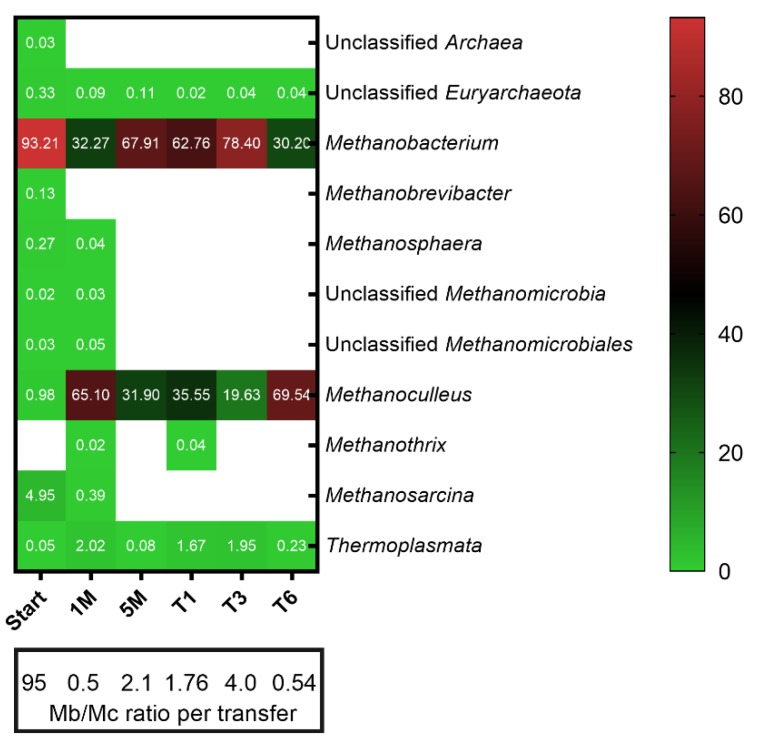
Figure 2.
Methanogenic community structure in different stages of the enrichment. Taxa with a relative abundance less than 0.01% were filtered out from all samples. Numbers represent the relative abundance in percent and blank space indicates the absence of the respective taxa. The ratio of the most dominant methanogens, Methanobacterium (Mb) and Methanoculleus (Mc), among transfers is shown. Mean values of three biological replicates are presented for T1, T3 and T6 whereas single values are shown for Start, 1 M and 5 M.

