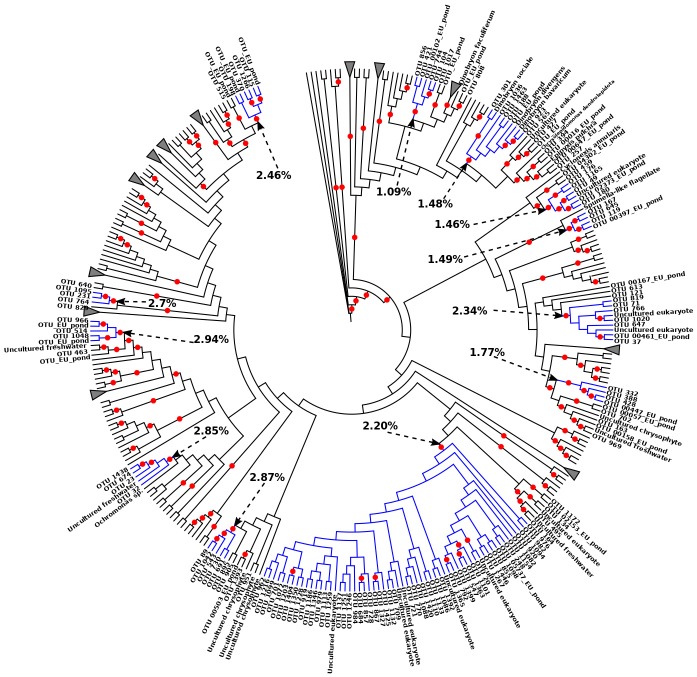
Figure 5.
Reduced Chrisophyceae ML tree (See full version of the tree in Figure S11). Potential species flocks are indicated in blue. The percentages indicate the average divergence of the sequences within each flock. Red circles correspond to bootstrap supports > 60.

