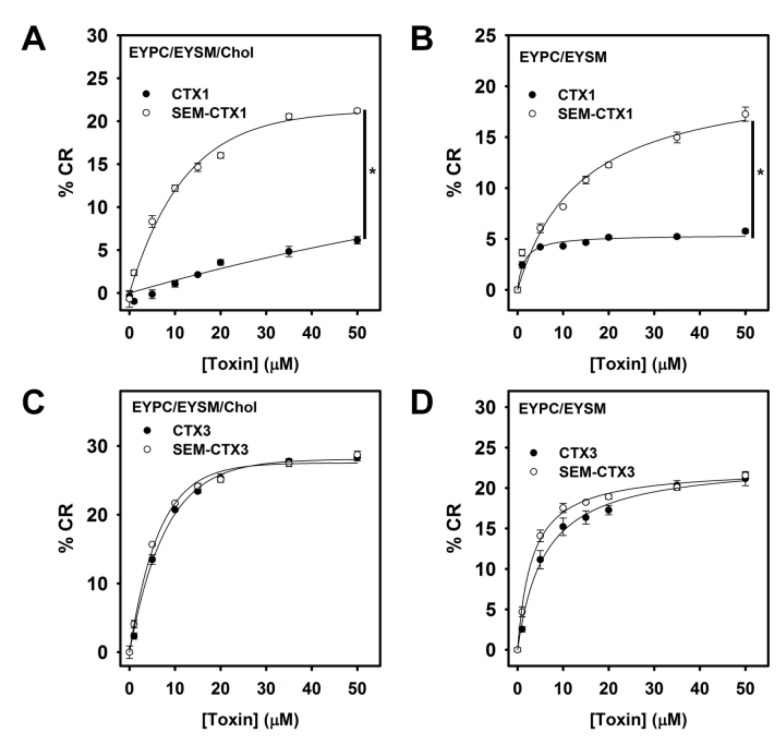
Figure 10.
Colorimetric dose-response curve of PDA/EYPC/EYSM and PDA/EYPC/EYSM/Chol vesicles titrated with CTX1, SEM-CTX1, CTX3, and SEM-CTX3. The experiments were conducted essentially according to the procedure described in Materials and Methods section. Each value is the mean ± SD of three independent experiments (* p < 0.05). The total lipid concentration of (A,C) PDA/EYPC/EYSM/Chol and (B,D) PDA/EYPC/EYSM solution was 0.5 mM.

