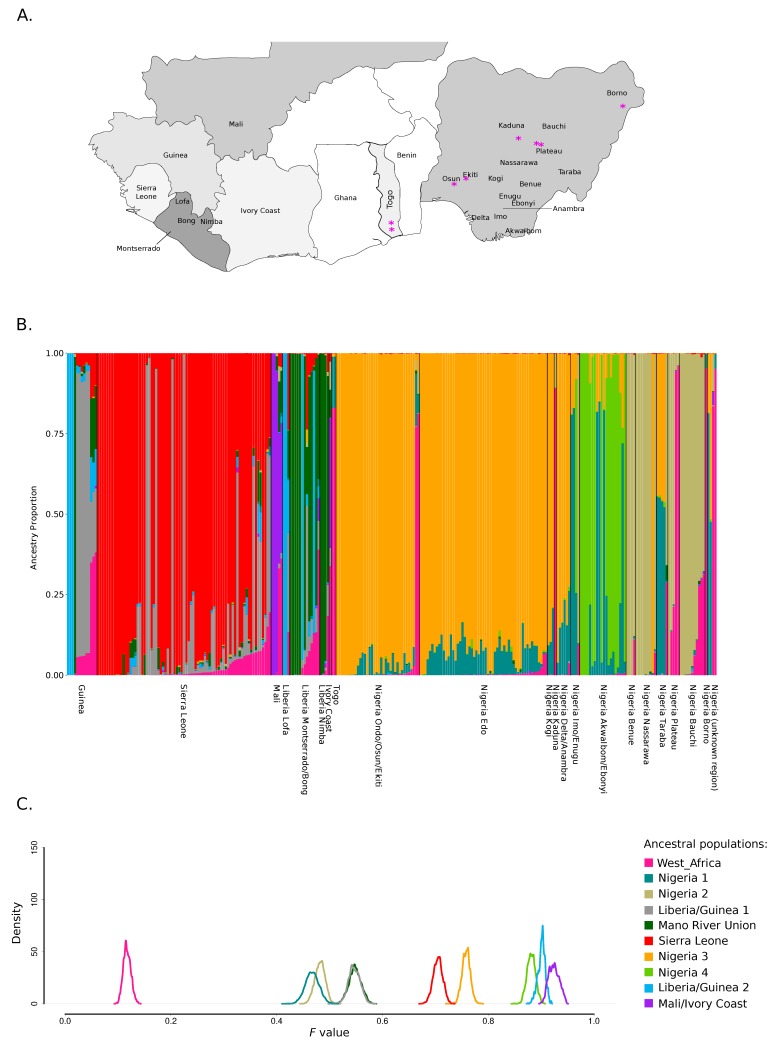
Figure 1.
Population structure of Lassa mammarenavirus (LASV) in West Africa. (A). Map of the LASV endemic area in West Africa. Countries where LASV genomes were sampled are shaded in different hues of gray. In Nigeria and Liberia, the states/prefectures of origin of LASV sequences are shown. The magenta asterisks denote the origin of sequences having a major ancestry component from ancestral population West_Africa. (B). Bar plot representing the proportion of ancestral population components from the STRUCTURE linkage model for K = 10. Each vertical line represents a LASV genome. Genomes are ordered by country and by following a roughly west-to-east gradient. (C). Distributions of posterior F values for the ancestral populations. Colors are as in panel B.

