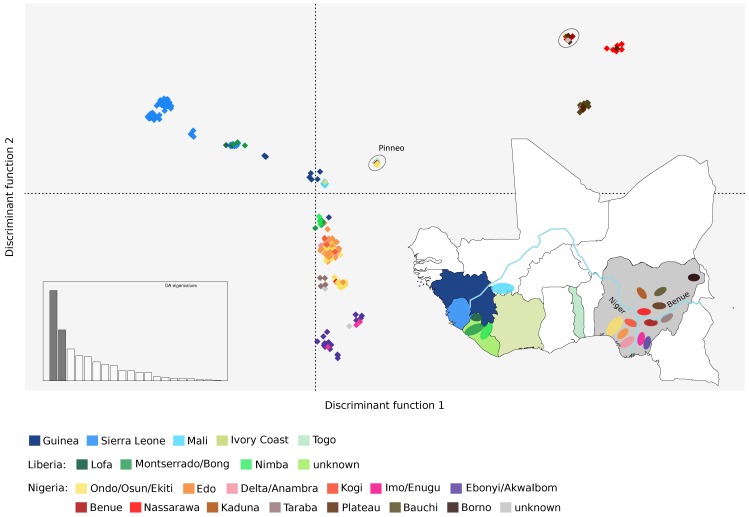
Figure 3.
Geographic clustering of LASV genomes. Results of the discriminant analysis of principal components (DAPC) are shown. The first two discriminant functions, which explain the majority of variance in the data (inset), are plotted. Distance on the plot is proportional to genetic distance between clusters. Samples are color-coded based on their geographic origin, as shown in the map of West Africa. The two clusters containing sequences with a large proportion of ancestry from population West_Africa are circled (the one with the Pinneo strain is marked).

