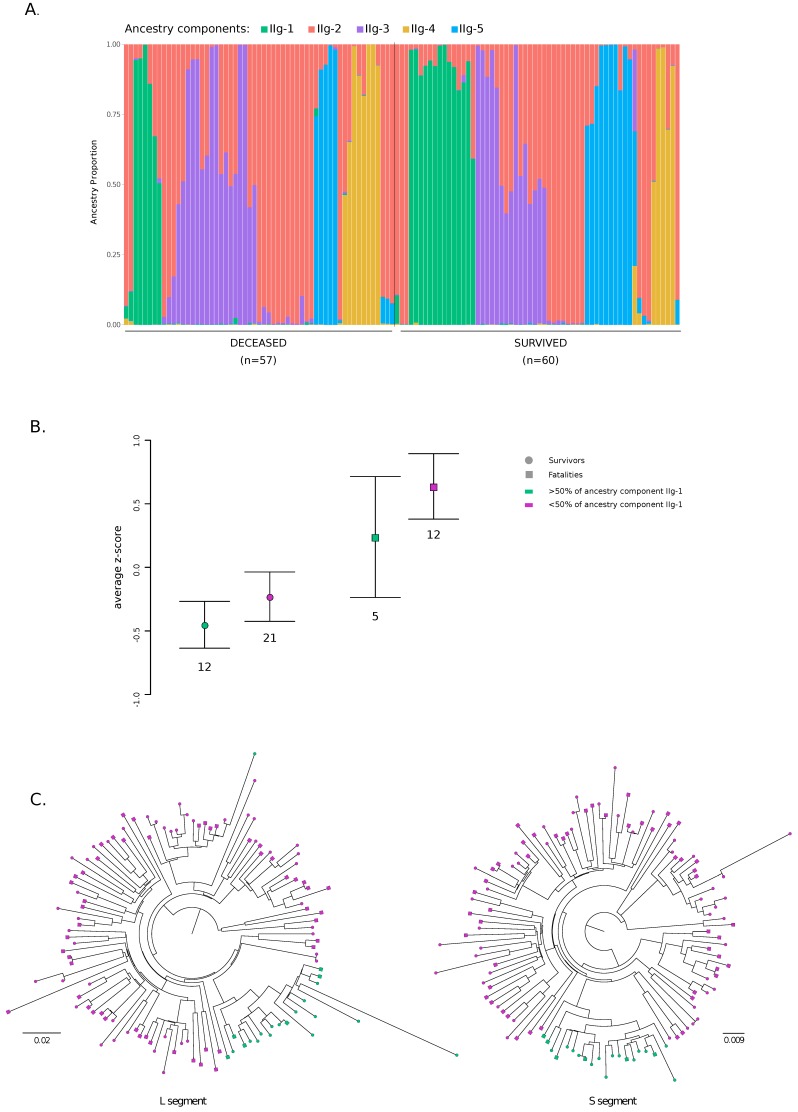
Figure 4.
Population structure for lineage IIg and association with clinical outcome. (A). Bar plot representing the proportion of ancestral population components from the STRUCTURE linkage model for K = 5. Each vertical line represents a LASV genome. Genomes are ordered by clinical outcome. (B) Comparisons of plasma viral loads (average z-scores) for patients infected with viruses having more or less that 50% of ancestry from component IIg-1. Values are reported as mean and standard error. (C) Phylogenies of the L and S segment for lineage IIg viruses were constructed using RAxML. Tips are coded to indicate disease outcome. Genomes with more that 50% of ancestry from component IIg-1 are in green.

