Figure 1.
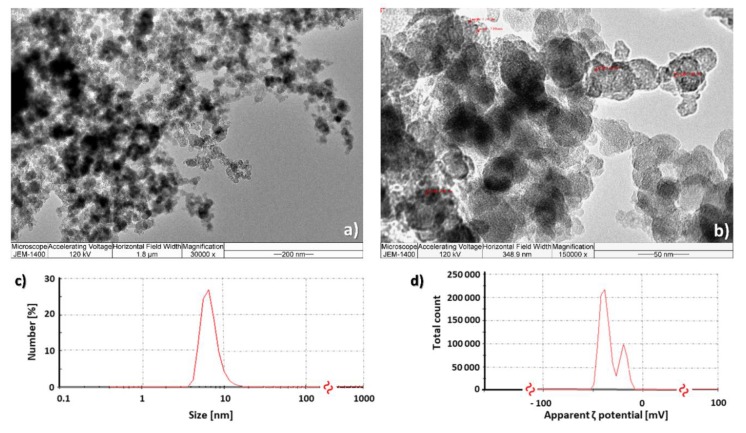
Fullerol C60(OH)24 aqueous nanoparticle solution (c = 10 mg mL−1) under transmission electron microscope (TEM) at 30,000× (a) and 150,000× (b) magnification, as well as particle size distribution by number (c) and apparent zeta potential (ζ) (d). The data represent one selected result out of three measurements and represent the mean hydrodynamic radius (c) and surface charge (d). -≈- values on x-axes not showed between 100–1000 on (c) and 0–100 on (d).

