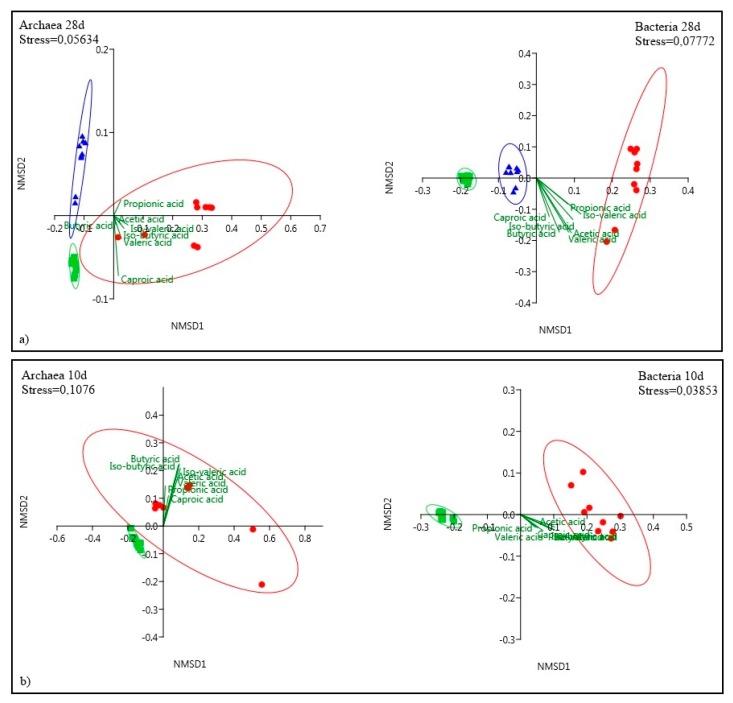
Figure 5.
NMDS plots of the (a) 28-day experiment and (b) 10-day experiment. Bray–Curtis dissimilarity index on Hellinger transformation of the amounts of OTUs has been applied. The ellipses indicate the probability of finding the samples with a 95% interval of confidence. Individual samples are represented by symbols, colored based on the inoculum treatment: control (square green), freeze-thaw (triangle blue) and thermal (dot red). Shepherds stress is indicated on the plots.

