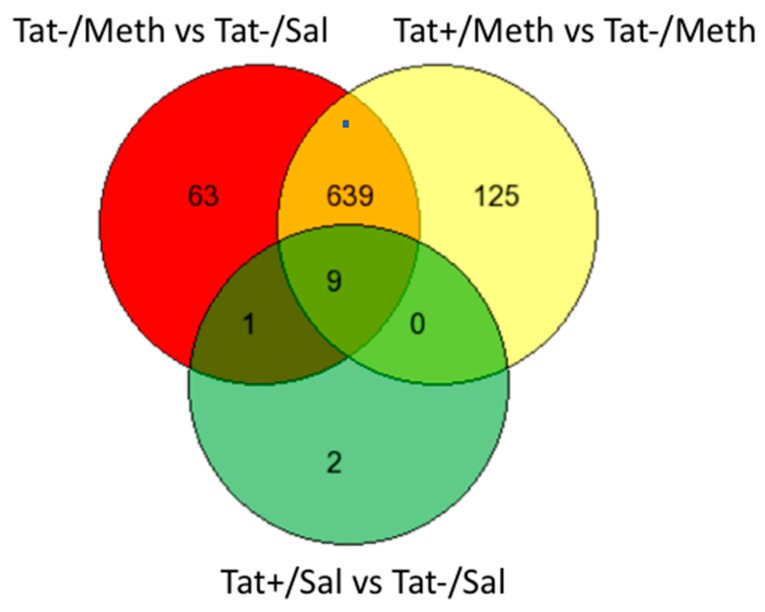
Figure 2.
Venn diagram showing the number of exclusive and overlapping signatures in assigned comparisons, regardless of direction, in different assigned comparisons. The comparisons between groups were established in order to identify the effect of Tat (Tat+/Sal vs. Tat−/Sal), the effect of Meth (Tat−/Meth vs. Tat−/Sal), the effect of Tat in the context of Meth (Tat+/Meth vs. Tat−Meth), and the effect of Meth in the context of Tat (Tat+/Meth vs. Tat+/Sal). There were 712 gene signatures identified for the comparison of Tat−/Meth with Tat−/Sal, of which 63 were exclusive to the effect of Meth. Tat+/Meth as compared with Tat−/Meth produced 773 gene signatures of which 125 were exclusive to the effect of Tat in the context of Meth. Between these two comparisons, a total of 648 genes overlapped in an anti-directional manner. The comparison, Tat+/Sal vs. Tat−/Sal, identified 12 gene signatures of which only two were exclusive to the effects of Tat. Nine of all signatures overlapped between all three comparisons. Since the comparison between Tat+/Meth and Tat+/Sal did not produce significant signatures, it is not included in this graph.

