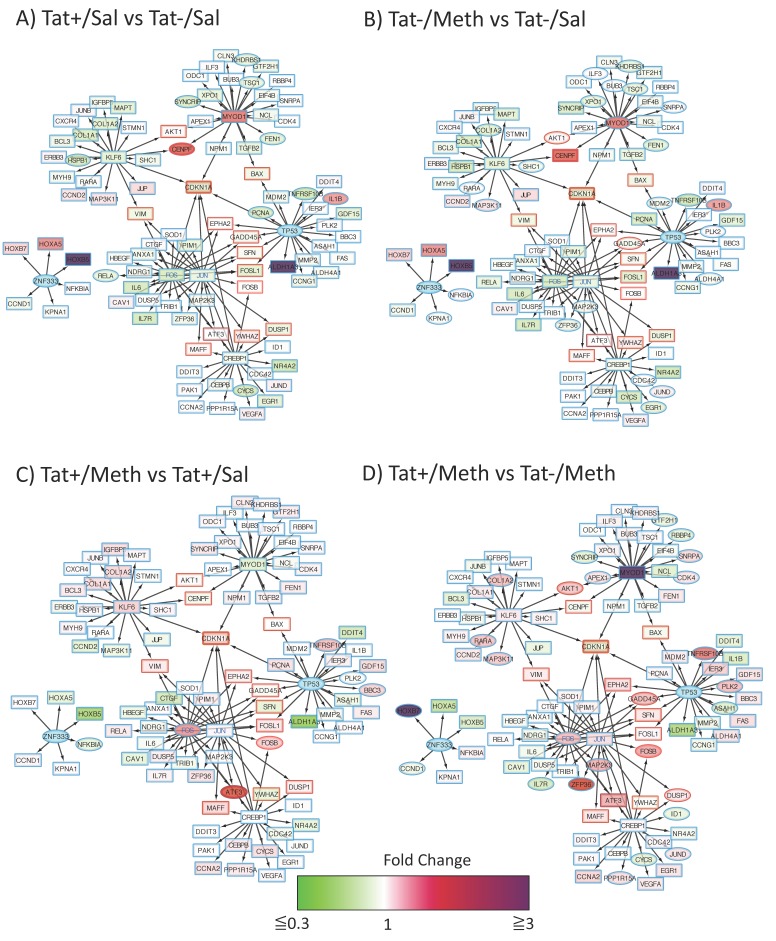
Figure 3.
Modeling of the interactions between predicted dominant transcription factors and their targets. Genes that were significantly modified by Meth alone and by Tat in the context of Meth were searched using iRegulon in Cytoscape, to identify targets of commonly relevant transcription factors according to TRANSFAC simulations. Then, individual networks were merged for the identification of common targets. Merged components were used for visualization of the impact of individual conditions by applying fold change data attributes. Red/magenta nodes represent upregulated and green nodes are downregulated changes. Elliptical shapes represent statistically significant changes. Red lines represent common targets between two or more transcription factors. Blue nodes represent transcription factors found to be relevant in TRANSFAC simulations, but not represented in the data. Each coded comparison allows the visualization of (A) the effects of Tat from the comparison of Tat+/Sal vs. Tat−/Sal; (B) the effects of Meth from the comparison of Tat−/Meth vs. Tat−/Sal; (C) the effects of Meth in the context of Tat, from the comparison between Tat+/Meth vs. Tat+/Sal; and (D) the effects of Tat in the context of Meth from the comparison between Tat+/Meth vs. Tat−/Meth.

