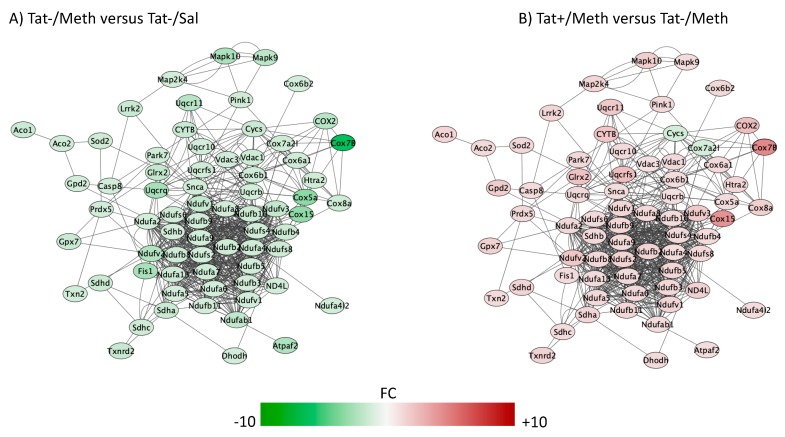
Figure 4.
Mitochondrial dysfunction pathway. Genes with overlapping actions observed in (A) Tat−/Meth vs. Tat−/Sal and in (B) Tat+/Meth vs. Tat−/Meth and assigned to mitochondrial dysfunction were loaded into Cytoscape via Genemania; significant changes (p < 0.01) associated to assigned comparisons were visualized by loading node attributes. Tat−/Meth vs. Tat−/Sal p = 4.80 × 10⁻¹⁵ and Tat+/Meth vs. Tat−/Meth p = 2.19 × 10⁻¹¹, with 65.5% and 57.9% overlap, respectively.

