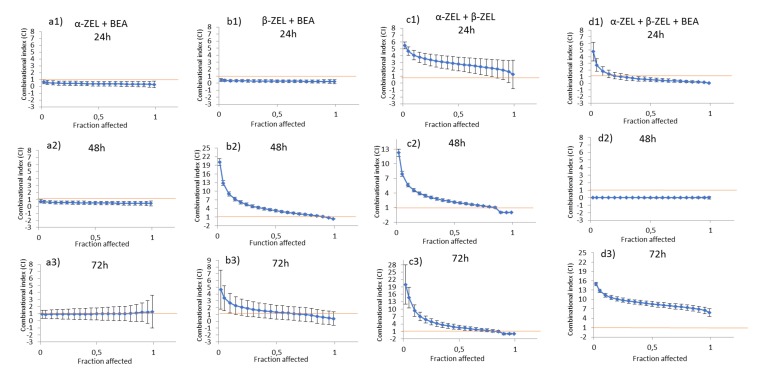
Figure 4.
CI vs. fractional effect curve, as described by Chou and Talalay, for SH-SY5Y cells exposed to α-ZEL, β-ZEL, and BEA in binary and tertiary combinations. Each point represents the CI ± SD at a fractional effect as determined in our experiments. The line (CI = 1) indicates additivity, the area under this line indicates synergism, and the area above the line indicates antagonism. SH-SY5Y cells were exposed for 24, 48, and 72 h to α-ZEL + BEA and β-ZEL + BEA at a molar ratio of 5:1 (equimolar proportion), to α-ZEL + β-ZEL at a molar ratio of 1:1, and to α-ZEL + β-ZEL + BEA at a molar ratio of 5:5:1.

