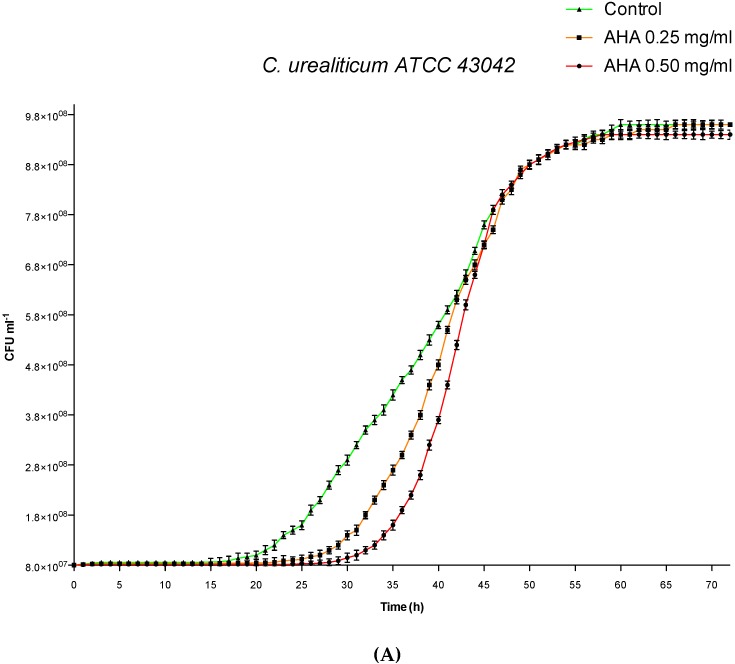
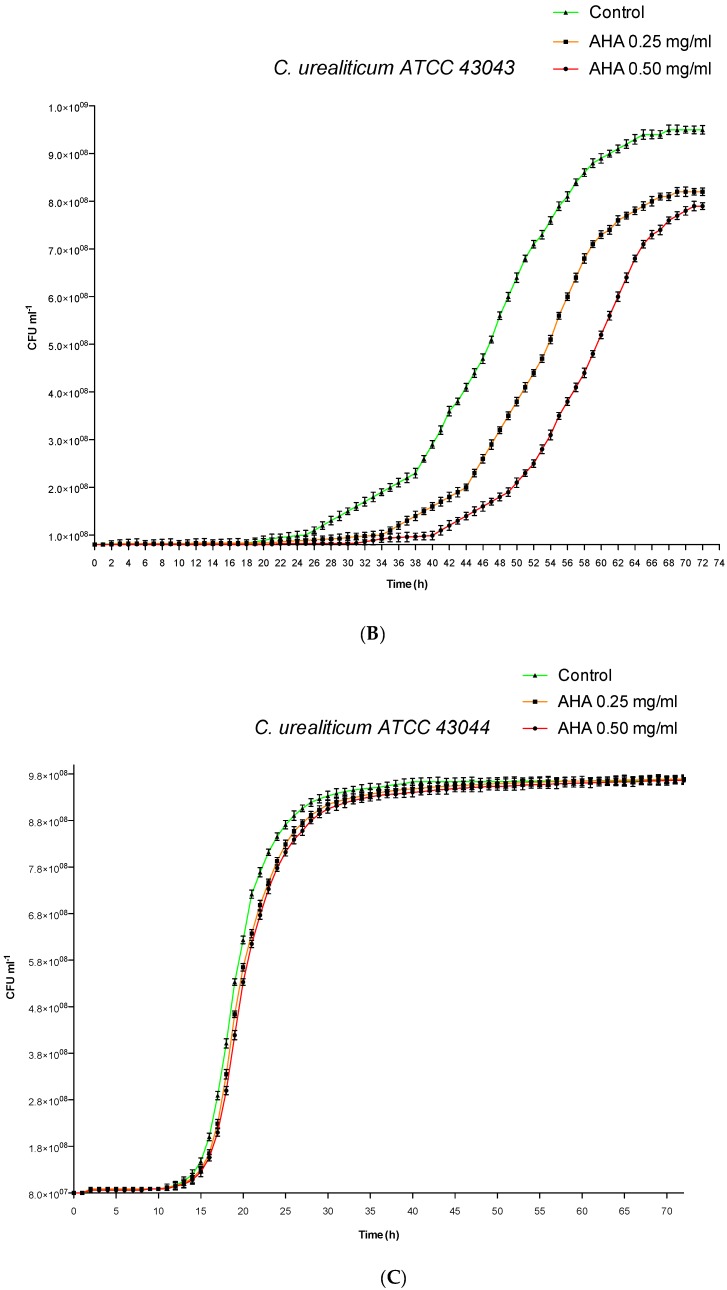
Figure 1.
Influence of AHA on in vitro growth curves by cell counting. Green lines: untreated controls. Orange lines: strains treated with AHA 0.25 mg/mL. Red lines: strains treated with AHA 0.50 mg/mL. (A) C. urealyticum ATCC 43042. (B) C. urealyticum ATCC 43043. (C) C. urealyticum 43044. The bars represent means ± SD of independent experiments performed in triplicate (SD = standard deviation).


