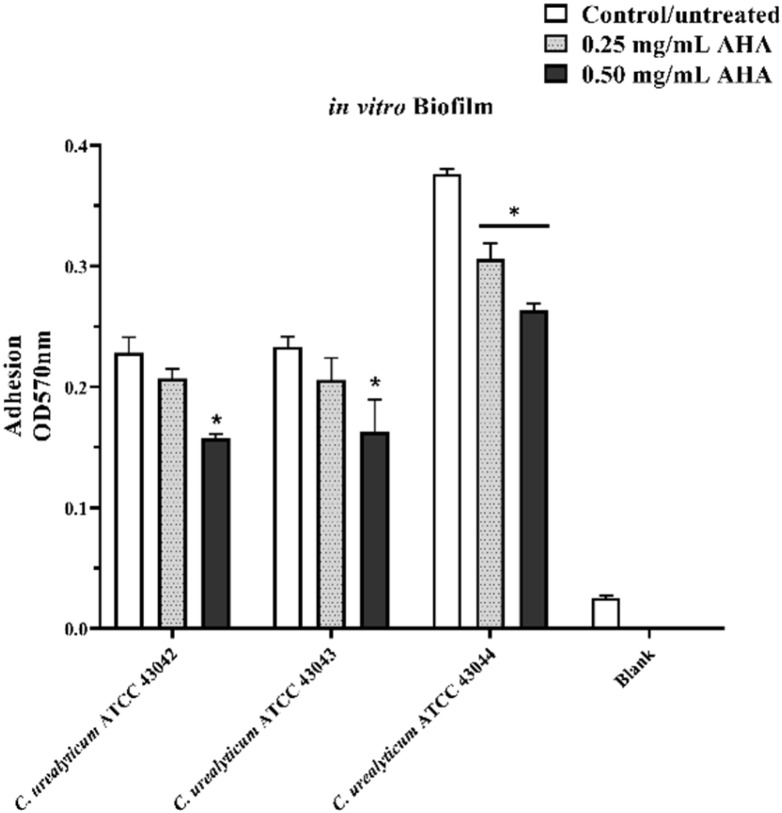
Figure 3.
Effects of AHA treatments on in vitro biofilm formation assay. In vitro biofilm formation from the three strains of C. urealyticum tested determined by crystal violet (CV) staining. Blank: negative control without bacterial strains. White histograms: strains not treated with AHA. Light grey histograms with dots: strains treated with 0.25 mg/mL AHA. Black histograms: strains treated with 0.50 mg/mL AHA. The bars represent means ± SD of three independent experiments performed in triplicate (SD = standard deviation). Statistically significant differences, determined by two-way analysis of variance ANOVA, are indicated: * p < 0.05 versus control/untreated.

