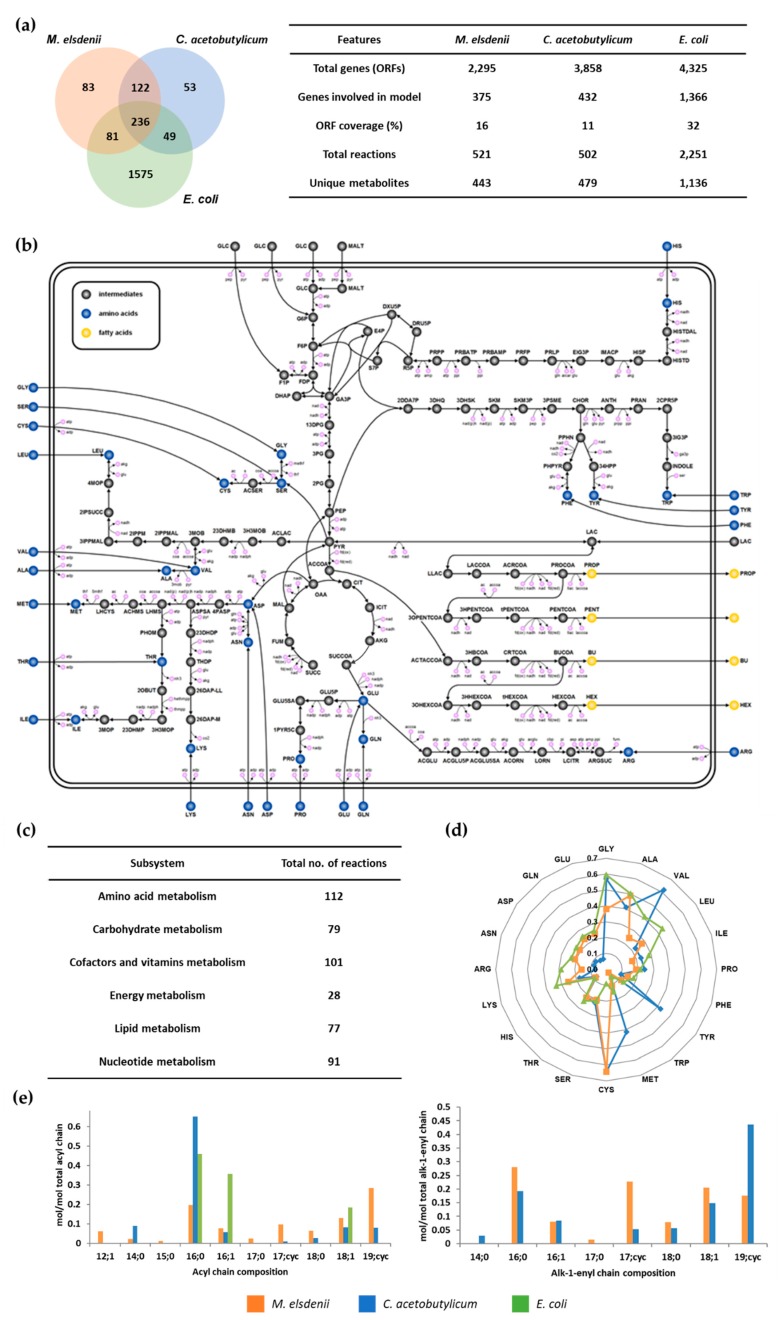
Figure 1.
Comparison of metabolic network models and biomass compositions. (a) The metabolic reactions of iME375 are compared with C. acetobutylicum CacMBEL489 and E. coli iJO1366. The numbers in the Venn diagram represent the number of metabolic reactions that are common and unique to the respective organisms. (b) The central metabolic network of M. elsdenii. (c) Distribution of reactions across various metabolic subsystems in iME375. (d) Amino acid composition (mmol/g protein) of three different in silico models. (e) Fatty acid composition (mmol/mol total acyl or alk-1-enyl chain fatty acids) of three different in silico models.

