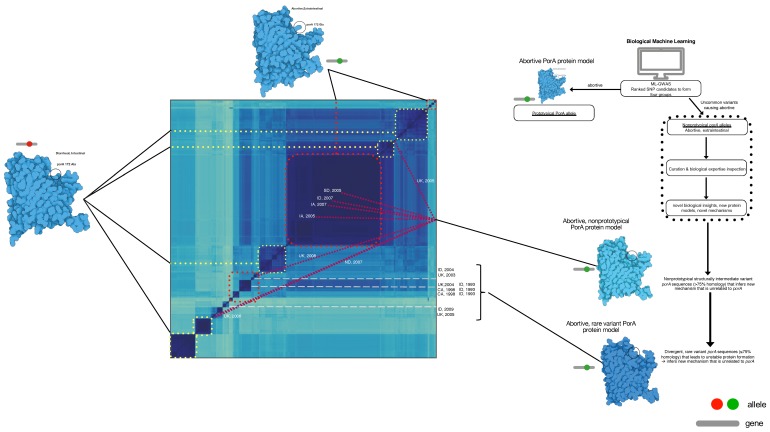
Figure 4.
Whole-genome distance matrix using MinHash depicting an all-against-all comparison of genome diversity for all isolates used in this study overlaid with the porA variant associated with body location and disease phenotype. Genotypes and porA alleles are connected in this depiction to examine the association between intestinal/diarrheal location (yellow dot boxes), prototypical extraintestinal/abortive (red dot boxes), non-prototypical porA alleles in extraintestinal/abortive (maroon lines), and rare porA variants in extraintestinal/abortive (grey dashed lines) were co-located to their respective genomes in the genotype map. For the non-prototypical variants, the year and location of isolation was included to depict the variation over time and space in the maintenance of a minority population of porA alleles of extraintestinal abortive C. jejuni. The diagram to the right depicts the process used for this analysis.

