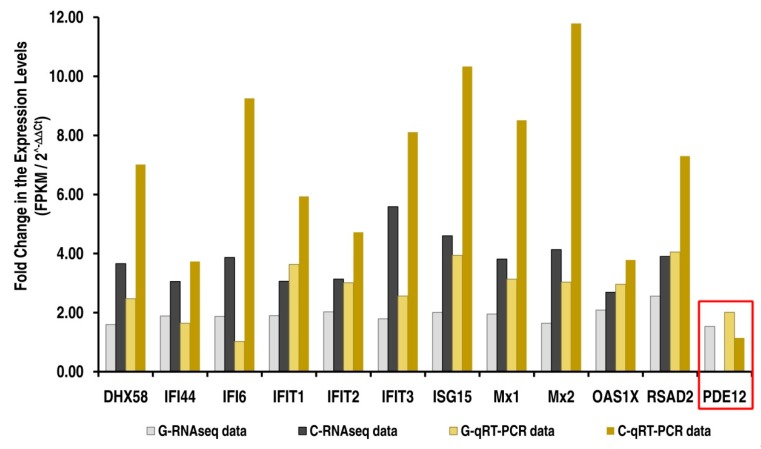
Figure 6.
Comparing the expression levels selected differentially expressed target genes (RNA-Seq vs RT-qPCR) in response to PPRV infection in Goat vs. Cattle. The fold change in the FPKM values of the identified target genes from the RNAseq data has been compared with the fold change in the expression levels validated by RT-qPCR experiments. The expression levels of the negative regulator of the 2′,5′-oligoadenylate system probably contributing to the decreased antiviral state induced by the interferons is boxed in red; G, Goat; C, Cattle.

